
Page 144 - {PDF Title}
P. 144
Mahto, et al.
parameters remain within limits, high pH, hardness, localized contamination, regular monitoring and
49
alkalinity, and nitrate levels in certain areas indicate treatment are recommended to ensure safe drinking water.
Table 2. Physicochemical characteristics of groundwater samples (2004 – 2020)
Characteristics of groundwater Min. Max. Average SD Permissible limit as
per IS 10500:2012
pH value 6.90 9.20 7.87 0.51 6.5 – 8.5
Electrical conductivity, μS/cm 242.00 2050.00 853.24 406.32 --
Total hardness, mg/L as CaCO 3 90.00 816.00 256.83 149.22 200
Total alkalinity, mg/L as CaCO 112.00 694.90 262.51 143.10 200
3
TDS, mg/L 114.00 1163.50 419.37 286.00 500
0.00 72.00 7.67 16.43 --
Carbonates, mg/L as CaCO 3
50.14 738.00 296.60 136.65 --
Bicarbonates, mg/L as CaCO 3
Chloride, mg/L 3.50 337.40 74.68 66.16 250
Sulphate, mg/L 0.00 144.10 43.45 42.56 200
Nitrate, mg/L 0.00 111.00 9.58 19.26 45
Calcium, mg/L 2.04 139.40 43.47 27.82 75
Magnesium, mg/L 3.60 118.66 34.91 24.12 30
Sodium, mg/L 9.54 215.00 74.24 48.47 --
Potassium, mg/L 0.00 80.80 8.40 15.58 --
Fluoride, mg/L 0.08 1.05 0.48 0.23 1
Abbreviations: SD: Standard deviation, TDS: Total dissolved solids.
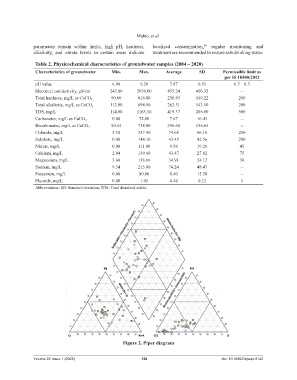
Figure 2. Piper diagram
Volume 22 Issue 1 (2025) 138 doi: 10.36922/ajwep.8142