
Page 149 - {PDF Title}
P. 149
Groundwater quality in Patna District
Table 3. (Continued)
Year No. of stations Station Latitude Longitude WQI Result
2019 7 Bhut Nath Road, Water Tank Sec-3, Kankarbagh 85.175 25.592 70.23 Fair
Katra Bazar, Water Tank, Malsalami, Patna 85.253 25.580 56.47 Marginal
IGIMS Campus, Patna 85.090 25.612 76.45 Fair
Water Board Head Office, Near High Court, Patna 85.138 25.610 75.62 Fair
Barh 85.705 25.473 48.01 Marginal
Maner 84.872 25.647 76.46 Fair
Overhead Tank, PMCH Campus, Patna 85.161 25.620 76.55 Fair
2020 7 Bhut Nath Road, Water Tank Sec-3, Kankarbagh 85.175 25.592 56.02 Marginal
Katra Bazar, Water Tank, Malsalami, Patna 85.253 25.580 100.00 Excellent
IGIMS Campus, Patna 85.090 25.612 57.57 Marginal
Water Board Head Office, Near High Court, Patna 85.138 25.610 100.00 Excellent
Barh 85.705 25.473 100.00 Excellent
Maner 84.872 25.647 100.00 Excellent
Overhead Tank, PMCH Campus, Patna 85.161 25.620 57.57 Marginal
Abbreviations: CCME: Canadian Council of Ministers of the Environment; WQI: Water Quality Index.
From the data, as shown in Table 3, it has been
observed that approximately 76% of water samples
from 106 locations come under the fair to excellent
water quality category during 2004 – 2020, and
approximately 24% of water samples from 33 locations
fall into marginal to bad water quality category.
Figure 3 also shows the percentage distribution of
sample locations into different water quality classes
using the CCME method.
To evaluate the spatial trends in groundwater quality
over time, a heatmap (Station vs. Year) was generated,
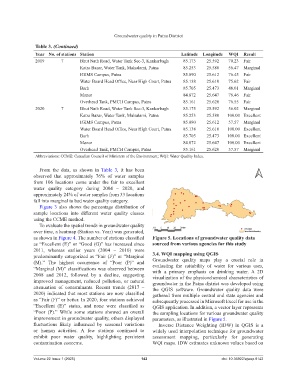
as shown in Figure 4. The number of stations classified Figure 5. Locations of groundwater quality data
as “Excellent (E)” or “Good (G)” has increased since sourced from various agencies for this study
2011, whereas earlier years (2004 – 2010) were
predominantly categorized as “Fair (F)” or “Marginal 3.4. WQI mapping using QGIS
(M).” The highest occurrence of “Poor (P)” and Groundwater quality maps play a crucial role in
evaluating the suitability of water for various uses,
“Marginal (M)” classifications was observed between with a primary emphasis on drinking water. A 2D
2008 and 2012, followed by a decline, suggesting visualization of the physicochemical characteristics of
improved management, reduced pollution, or natural groundwater in the Patna district was developed using
attenuation of contaminants. Recent trends (2017 – the QGIS software. Groundwater quality data were
2020) indicated that most stations are now classified gathered from multiple central and state agencies and
as “Fair (F)” or better. In 2020, four stations achieved subsequently processed in Microsoft Excel for use in the
“Excellent (E)” status, and none were classified as QGIS application. In addition, a vector layer represents
“Poor (P).” While some stations showed an overall the sampling locations for various groundwater quality
improvement in groundwater quality, others displayed parameters, as illustrated in Figure 5.
fluctuations likely influenced by seasonal variations Inverse Distance Weighting (IDW) in QGIS is a
or human activities. A few stations continued to widely used interpolation technique for groundwater
exhibit poor water quality, highlighting persistent assessment mapping, particularly for generating
contamination concerns. WQI maps. IDW estimates unknown values based on
Volume 22 Issue 1 (2025) 143 doi: 10.36922/ajwep.8142