
Page 114 - AJWEP-v22i2
P. 114
Ghasemi, et al.
region is approximately 74 million m , which is lower a reduction of more than 32% in the gross margin of
3
than that of the Bashet region. By the end of 2030, the farmers in the Kowsar Dam basin.
unmet water demand for Gachsaran’s agricultural areas To better understand the economic impacts of drought,
will reach about 75 million m . This represents roughly the cropping pattern under the drought scenario (reduced
3
28% of the total water demand for agricultural areas rainfall, higher temperatures, and limited water availability)
in the region. In other words, more than 28% of the is provided in Table 4 for the entire Kowsar Dam basin.
water demand in Gachsaran’s agricultural areas will go The drought scenario resulted in a 21% reduction in the
unmet in 2030 under drought conditions. Nevertheless, area dedicated to rice and wheat cultivation compared to
this region is expected to experience more favorable the normal scenario. Other crops remained unaffected.
conditions compared to the agricultural areas of the As a result, the total cultivated area in the Kowsar Dam
Bashet region. basin decreased by approximately 15% due to drought.
As shown in Figure 9, the unmet water demand in This reduction negatively impacts farmers’ welfare and
the Choram agricultural area started to increase after a food security in the studied areas. An analysis of farm-
sharp decrease in 2018. This upward trend will result level decision-making showed that crop pattern changes
in the unmet water demand for agricultural areas in do not fully capture the potential for farm-level adaptation
this region exceeding 45 million m by the end of the to mitigate the harmful effects of drought. 67
3
simulation period (2030). By 2030, more than 81% of
the water demand in the Choram region’s agricultural 3.5. Analysis of farmers’ behavior in dealing with
areas will remain unmet under drought conditions. drought
It can therefore be concluded that the water supply The SEM was examined using appropriate indicators,
situation for agricultural areas downstream of the basin and the results were presented in Table 5.
will be highly unfavorable over the next 30 years under The outcomes of the ultimate influence of variables
drought conditions. on farmers’ behavior are displayed in Figure 11. The
3.4. Socioeconomic impacts of drought scenario
The outputs of the simulation of crop yields, water
needs, and water availability, both with and without
drought scenarios in the Kowsar Dam basin, were used
as inputs for the PMP model. The PMP model was then
run for typical farms in all three regions, both with and
without the proposed drought scenarios, and the results
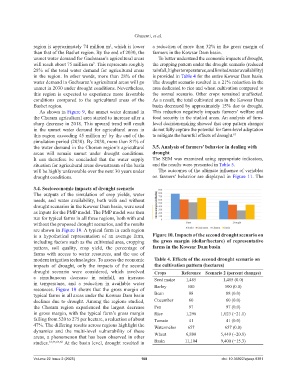
are shown in Figure 10. A typical farm in each region
is a hypothetical representation of an average farm, Figure 10. Impacts of the second drought scenario on
including factors such as the cultivated area, cropping the gross margin (dollar/hectare) of representative
pattern, soil quality, crop yield, the percentage of farms in the Kowsar Dam basin
farms with access to water resources, and the use of
modern irrigation technologies. To assess the economic Table 4. Effects of the second drought scenario on
impacts of drought, only the impacts of the second the cultivation pattern (hectares)
drought scenario were considered, which involved Crops Reference Scenario 2 (percent changes)
a simultaneous decrease in rainfall, an increase Seed maize 1,485 1,485 (0.0)
in temperature, and a reduction in available water
resources. Figure 10 shows that the gross margin of Barley 500 500 (0.0)
typical farms in all areas under the Kowsar Dam basin Bean 88 88 (0.0)
declines due to drought. Among the regions studied, Cucumber 60 60 (0.0)
the Choram region experienced the largest decrease Pea 97 97 (0.0)
in gross margin, with the typical farm’s gross margin Rice 1,296 1,023 (−21.1)
falling from 520 to 275 per hectare, a reduction of about Tomato 41 41 (0.0)
47%. The differing results across regions highlight the Watermelon 657 657 (0.0)
dynamics and the multi-level vulnerability of these
areas, a phenomenon that has been observed in other Wheat 6,880 5,449 (−20.8)
studies. 12,35,67,68 At the basin level, drought resulted in Basin 11,104 9,400 (−15.3)
Volume 22 Issue 2 (2025) 108 doi: 10.36922/ajwep.8381