
Page 111 - AJWEP-v22i2
P. 111
Assessing drought impacts for adaptive response
3.2. Technical-agronomic impacts of drought scenarios increase in temperature. The second scenario included
Two drought scenarios were created for this study. The a decrease in rainfall, an increase in temperature, and a
first scenario involved a decrease in rainfall and an reduction in the amount of water available in the basin
(based on climate data from 2013 to 2020). The impacts
of these scenarios on crop yields and water requirements
are shown in Tables 2 and 3.
Table 2 demonstrates that, under the first drought
scenario (reduced rainfall and higher temperatures),
the average yield of all crops in the Bashet, Gachsaran,
and Choram regions will decrease. In the Bashet region,
wheat crops will experience the largest yield reduction,
while tomato and rice crops will see the smallest
reductions. In the Gachsaran region, the yield reduction
will range from 0.6% to over 4% across all crops,
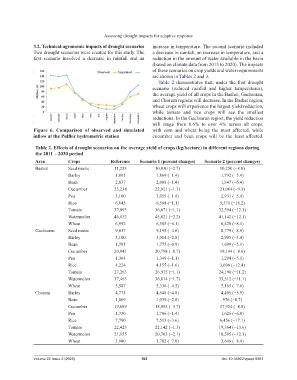
Figure 6. Comparison of observed and simulated with corn and wheat being the most affected, while
inflow at the Pulflor hydrometric station cucumber and bean crops will be the least affected.
Table 2. Effects of drought scenarios on the average yield of crops (kg/hectare) in different regions during
the 2011 – 2030 period
Area Crops Reference Scenario 1 (percent changes) Scenario 2 (percent changes)
Bashet Seed maize 11,233 10,930 (−2.7) 10,250 (−8.8)
Barley 1,895 1,869 (−1.4) 1,792 (−5.4)
Bean 2,037 2,008 (−1.4) 1,847 (−6.4)
Cucumber 23,234 22,921 (−1.3) 21,064 (−9.3)
Pea 3,100 3,055 (−1.4) 2,931 (−5.4)
Rice 6,645 6,568 (−1.1) 5,571 (−16.2)
Tomato 37,093 36,671 (−1.1) 32,594 (−12.1)
Watermelon 46,832 45,821 (−2.2) 41,142 (−12.1)
Wheat 6,992 6,565 (−6.1) 6,428 (−8.1)
Gachsaran Seed maize 9,637 9,195 (−4.6) 8,779 (−8.9)
Barley 3,100 3,014 (−2.8) 2,995 (−3.4)
Bean 1,791 1,775 (−0.9) 1,699 (−5.1)
Cucumber 20,941 20,798 (−0.7) 19,144 (−8.6)
Pea 1,364 1,349 (−1.1) 1,294 (−5.1)
Rice 4,224 4,155 (−1.6) 3,699 (−12.4)
Tomato 27,263 26,975 (−1.1) 24,196 (−11.2)
Watermelon 37,463 36,814 (−1.7) 33,312 (−11.1)
Wheat 5,587 5,336 (−4.5) 5,165 (−7.6)
Choram Barley 4,775 4,548 (−4.8) 4,495 (−5.9)
Bean 1,069 1,039 (−2.8) 976 (−8.7)
Cucumber 19,689 18,955 (−3.7) 17,954 (−8.8)
Pea 1,730 1,706 (−1.4) 1,626 (−6.0)
Rice 7,790 7,513 (−3.6) 6,456 (−17.1)
Tomato 22,423 22,142 (−1.3) 19,364 (−13.6)
Watermelon 21,155 20,703 (−2.1) 18,595 (−12.1)
Wheat 3,980 3,702 (−7.0) 3,646 (−8.4)
Volume 22 Issue 2 (2025) 105 doi: 10.36922/ajwep.8381