
Page 110 - AJWEP-v22i2
P. 110
Ghasemi, et al.
Table 1. Survey items
Constructs Measurement item ƛ t Reliability and Sources
validity statistics
Sources Att1: Living in the rural is enjoyable even in the presence 0.601 6.834 AVE: 0.601 38,47,52,58
of drought CR: 0.830
Att2: My adaptation to drought has great value for the 13.145 0.773 α: 0.804
community
Att3: My adaptation to drought is very necessary 10.206 0.711
Att4: My adaptation to drought is completely rational 10.039 0.702
Att5: My adaptation to drought is beneficial 8.255 0.643
Subjective Sn1: If I adapt to drought, my friends, relatives and 19.185 0.818 AVE: 0.712 38,47,59,60
norms neighbors will approve my actions CR: 0.884
Sn2: If I adapt to drought, the people who are important 18.746 0.809 α: 0.827
to me will approve my actions
Sn3: If I adapt to drought, the society will approve my 25.342 0.853
actions
Sn4: Rural community expects me to continue my 11.950 0.754
activities even in the presence of drought.
Perceived Pbc1: I have the knowledge, and ability to adapt to 10.860 0.733 AVE: 0.688 47,61-63
behavior drought CR: 0.855
control Pbc2: I have the necessary skills to implement adaptation 9.128 0.685 α: 0.822
strategies
Pbc3: I want to adapt to drought 13.726 0.782
Intentions Int1: I’d like to stay in the rural despite the drought 26.840 0.885 AVE: 0.760 38,64
Int2: I’d like to engage in drought adaptation programs 28.105 0.897 CR: 0.906
Int3: I plan to engage in drought adaptation programs 15.897 0.792 α: 0.883
Behavior B1: I stay in the rural despite the drought and implement 10.926 0.728 AVE: 0.632
drought adaptation strategies CR: 0.850
α: 0.817
Notes: Response scale (1 – 5): Strongly disagree–Strongly agree; α=Cronbach’s alpha. Abbreviations: Att: Attitude; AVE: Average
variance extracted; B: Behavior; CR: Composite Reliability; Int: Intention; Pbc: Perceived behavior control; Sn: Subjective norms.
3. Results and discussion
3.1. Validation assessment of hydrological
simulation
The PEST tool was used to assess the performance
of the WEAP model. It allows users to automatically
compare the model’s results with real-world data and
adjust the model’s settings to enhance its accuracy. This
tool used water flow data from hydrometric stations to
evaluate the accuracy of the model’s simulations and
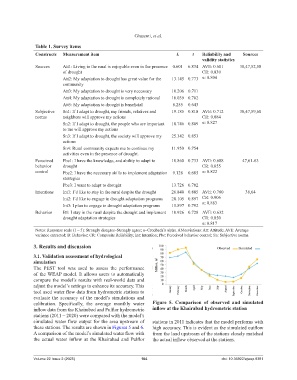
calibration. Specifically, the average monthly water Figure 5. Comparison of observed and simulated
inflow data from the Khairabad and Pulflor hydrometric inflow at the Khairabad hydrometric station
stations (2011 – 2020) were compared with the model’s
simulated water flow output for the area upstream of stations in 2011 indicates that the model performs with
these stations. The results are shown in Figures 5 and 6. high accuracy. This is evident as the simulated outflow
A comparison of the model’s simulated water flow with from the land upstream of the stations closely matched
the actual water inflow at the Khairabad and Pulflor the actual inflow observed at the stations.
Volume 22 Issue 2 (2025) 104 doi: 10.36922/ajwep.8381