
Page 112 - AJWEP-v22i2
P. 112
Ghasemi, et al.
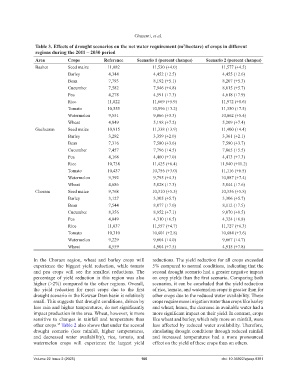
Table 3. Effects of drought scenarios on the net water requirement (m /hectare) of crops in different
3
regions during the 2011 – 2030 period
Area Crops Reference Scenario 1 (percent changes) Scenario 2 (percent changes)
Bashet Seed maize 11,082 11,530 (+4.0) 11,577 (+4.5)
Barley 4,344 4,452 (+2.5) 4,455 (+2.6)
Bean 7,793 8,192 (+5.1) 8,207 (+5.3)
Cucumber 7,582 7,946 (+4.8) 8,015 (+5.7)
Pea 4,278 4,591 (+7.3) 4,618 (+7.9)
Rice 11,022 11,669 (+5.9) 11,972 (+8.6)
Tomato 10,555 10,896 (+3.2) 11,350 (+7.5)
Watermelon 9,551 9,866 (+3.3) 10,062 (+5.4)
Wheat 4,849 5,198 (+7.2) 5,209 (+7.4)
Gachsaran Seed maize 10,915 11,338 (+3.9) 11,400 (+4.4)
Barley 3,292 3,359 (+2.0) 3,361 (+2.1)
Bean 7,316 7,580 (+3.6) 7,590 (+3.7)
Cucumber 7,457 7,796 (+4.5) 7,865 (+5.5)
Pea 4,168 4,460 (+7.0) 4,473 (+7.3)
Rice 10,738 11,425 (+6.4) 11,940 (+11.2)
Tomato 10,437 10,756 (+3.0) 11,116 (+6.5)
Watermelon 9,392 9,795 (+4.3) 10,087 (+7.4)
Wheat 4,686 5,028 (+7.3) 5,044 (+7.6)
Choram Seed maize 9,768 10,310 (+5.5) 10,336 (+5.8)
Barley 3,127 3,305 (+5.7) 3,306 (+5.7)
Bean 7,544 8,077 (+7.0) 8,112 (+7.5)
Cucumber 8,356 8,952 (+7.1) 9,070 (+8.5)
Pea 4,049 4,310 (+6.5) 4,324 (+6.8)
Rice 11,037 11,557 (+4.7) 11,727 (+6.3)
Tomato 10,310 10,601 (+2.8) 10,684 (+3.6)
Watermelon 9,229 9,604 (+4.0) 9,667 (+4.7)
Wheat 4,559 4,904 (+7.5) 4,915 (+7.8)
In the Choram region, wheat and barley crops will reductions. The yield reduction for all crops exceeded
experience the biggest yield reduction, while tomato 5% compared to normal conditions, indicating that the
and pea crops will see the smallest reductions. The second drought scenario had a greater negative impact
percentage of yield reduction in this region was also on crop yields than the first scenario. Comparing both
higher (>2%) compared to the other regions. Overall, scenarios, it can be concluded that the yield reduction
the yield reduction for most crops due to the first of rice, tomato, and watermelon crops is greater than for
drought scenario in the Kowsar Dam basin is relatively other crops due to the reduced water availability. These
small. This suggests that drought conditions, driven by crops require more irrigation water than crops like barley
less rain and higher temperatures, do not significantly and wheat; hence, the decrease in available water had a
impact production in the area. Wheat, however, is more more significant impact on their yield. In contrast, crops
sensitive to changes in rainfall and temperature than like wheat and barley, which rely more on rainfall, were
other crops. Table 2 also shows that under the second less affected by reduced water availability. Therefore,
35
drought scenario (less rainfall, higher temperatures, simulating drought conditions through reduced rainfall
and decreased water availability), rice, tomato, and and increased temperatures had a more pronounced
watermelon crops will experience the largest yield effect on the yield of these crops than on others.
Volume 22 Issue 2 (2025) 106 doi: 10.36922/ajwep.8381