
Page 178 - AJWEP-v22i2
P. 178
Ali and Al-Hasnawi
Sentinel-1
Import images
Sentinel Radiometric Radiometric thermal Terrain
-1 Subset calibrate terrain noise correction DEM
images removal
Figure 3. The flowchart of digital elevation model generation
Import Export
Sentinel Geometric Resampling Subset Select bands (2, (GeoTiff/
-2 (10 m) 3, 4, and 8) Big Geo Tiff)
images
Figure 4. The flowchart of Sentinel-2 pre-processing
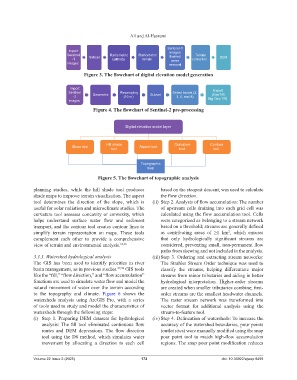
Digital elevation model layer
Hill shade Curvature Contour
Slope tool Aspect tool
tool tool tool
Topographic
map
Figure 5. The flowchart of topographic analysis
planning studies, while the hill shade tool produces based on the steepest descent, was used to calculate
shade maps to improve terrain visualization. The aspect the flow direction.
tool determines the direction of the slope, which is (ii) Step 2. Analysis of flow accumulation: The number
useful for solar radiation and microclimate studies. The of upstream cells draining into each grid cell was
curvature tool assesses concavity or convexity, which calculated using the flow accumulation tool. Cells
helps understand surface water flow and sediment were categorized as belonging to a stream network
transport, and the contour tool creates contour lines to based on a threshold; streams are generally defined
2
simplify terrain representation on maps. These tools as contributing areas of ≥1 km , which ensures
complement each other to provide a comprehensive that only hydrologically significant streams are
view of terrain and environmental analysis. 35,36 considered, preventing small, non-permanent flow
paths from skewing and not included in the analysis.
3.3.3. Watershed hydrological analysis (iii) Step 3. Ordering and extracting stream networks:
The GIS has been used to identify priorities in river The Strahler Stream Order technique was used to
basin management, as in previous studies. 37,38 GIS tools classify the streams, helping differentiate major
like the “fill,” “flow direction,” and “flow accumulation” streams from minor tributaries and aiding in better
functions are used to simulate water flow and model the hydrological interpretation. Higher-order streams
natural movement of water over the terrain according are created when smaller tributaries combine; first-
to the topography and climate. Figure 6 shows the order streams are the smallest headwater channels.
watersheds analysis using ArcGIS Pro, with a series The raster stream network was transformed into
of tools used to study and model the characteristics of vector format for additional analysis using the
watersheds through the following steps: stream-to-feature tool.
(i) Step 1. Preparing DEM datasets for hydrological (iv) Step 4. Delineation of watersheds: To increase the
analysis: The fill tool eliminated continuous flow accuracy of the watershed boundaries, pour points
routes and DEM depressions. The flow direction (outlet sites) were manually modified using the snap
tool using the D8 method, which simulates water pour point tool to match high-flow accumulation
movement by allocating a direction to each cell regions. The snap pour point modification reduces
Volume 22 Issue 2 (2025) 172 doi: 10.36922/ajwep.8499