
Page 183 - AJWEP-v22i2
P. 183
Topographic and watershed analysis
Figure 13. The flow direction map of the study area
Figure 14. The flow accumulation map of the study area. Flow accumulation value: 2.39383 × 10 .
7
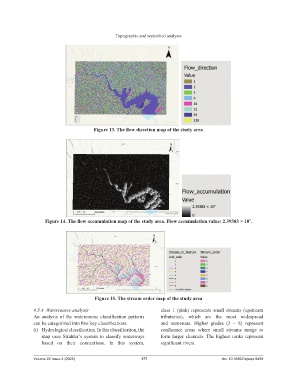
Figure 15. The stream order map of the study area
4.3.4. Watercourse analysis class 1 (pink) represents small streams (upstream
An analysis of the watercourse classification patterns tributaries), which are the most widespread
can be categorized into five key classifications. and numerous. Higher grades (2 – 8) represent
(i) Hydrological classification. In this classification, the confluence areas where small streams merge to
map uses Strahler’s system to classify waterways form larger channels. The highest ranks represent
based on their connections. In this system, significant rivers.
Volume 22 Issue 2 (2025) 177 doi: 10.36922/ajwep.8499