
Page 181 - AJWEP-v22i2
P. 181
Topographic and watershed analysis
Figure 10. The hill shade map of the study area
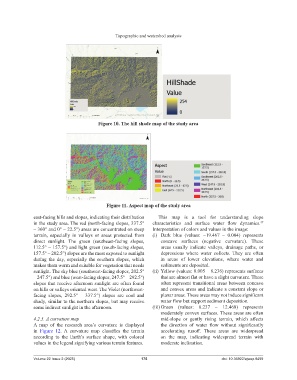
Figure 11. Aspect map of the study area
east-facing hills and slopes, indicating their distribution This map is a tool for understanding slope
in the study area. The red (north-facing slopes, 337.5° characteristics and surface water flow dynamics.
47
– 360° and 0° – 22.5°) areas are concentrated on steep Interpretation of colors and values in the image:
terrain, especially in valleys or areas protected from (i) Dark blue (values: −19.467 – 0.004) represents
direct sunlight. The green (southeast-facing slopes, concave surfaces (negative curvature). These
112.5° – 157.5°) and light green (south-facing slopes, areas usually indicate valleys, drainage paths, or
157.5° – 202.5°) slopes are the most exposed to sunlight depressions where water collects. They are often
during the day, especially the southern slopes, which in areas of lower elevations, where water and
makes them warm and suitable for vegetation that needs sediments are deposited.
sunlight. The sky blue (southwest-facing slopes, 202.5° (ii) Yellow (values: 0.005 – 6.236) represents surfaces
– 247.5°) and blue (west-facing slopes, 247.5° – 292.5°) that are almost flat or have a slight curvature. These
slopes that receive afternoon sunlight are often found often represent transitional areas between concave
on hills or valleys oriented west. The Violet (northwest- and convex areas and indicate a constant slope or
facing slopes, 292.5° – 337.5°) slopes are cool and planar areas. These areas may not induce significant
shady, similar to the northern slopes, but may receive water flow but support sediment deposition.
some indirect sunlight in the afternoon. (iii) Green (values: 6.237 – 12.468) represents
moderately convex surfaces. These areas are often
4.2.5. A curvature map mid-slope or gently rising terrain, which affects
A map of the research area’s curvature is displayed the direction of water flow without significantly
in Figure 12. A curvature map classifies the terrain accelerating runoff. These areas are widespread
according to the Earth’s surface shape, with colored on the map, indicating widespread terrain with
values in the legend signifying various terrain features. moderate inclination.
Volume 22 Issue 2 (2025) 175 doi: 10.36922/ajwep.8499