
Page 179 - AJWEP-v22i2
P. 179
Topographic and watershed analysis
watershed delineation mistakes brought on by resource management. For example, LULC analysis was
limitations in DEM resolution. Individual sub- used to study the impact of land use changes on river
basins were created using the watershed tool, and flows and flood risk in the Grand Ethiopian Renaissance
their contributions to the Haditha Dam reservoir Dam basin. In this study, LULCs were classified using
were examined. the unsupervised classification method in ArcGIS Pro,
The fill tool removed dips in the DEM to ensure resulting in four main categories: water, vegetation,
flow continuity, the flow direction tool determined urban areas, and soil, as shown in Figure 7.
the direction of water flow for each cell, and the
flow accumulation tool calculated the number of 4. Results
cells contributing to flow to define stream networks.
Con tool was used to extract specific paths based on 4.1. Sentinel-1 pre-processing
certain conditions, stream order tool classified streams The DEM produced by the SNAP program following
hierarchically, and stream-to-feature converted point the pre-processing of the Sentinel-1 image is shown in
data to vectors. The contour tool created contour lines Figure 8. Pre-processing is altering the original data
table to create a new one, which includes using various
to visualize terrain, the basin identified individual techniques to change the data before latent vectors are
basins, the snap pour point tool adjusted pour points to extracted. Artificial intelligence devised a definition
match the highest flow accumulation, and the watershed based on scientific data handling. 44
tool identified and delineated the watershed catchment
areas based on pour points. These tools provided a 4.2. Topographic analysis
comprehensive framework for understanding watershed 4.2.1. Slope analysis
dynamics and planning resource management. 39,40 As shown in Figure 9, slope analysis using a DEM is
a process that extracts information about the slope and
3.3.4. LULC classification the orientation of the terrain. The calculated slope value
Remote sensing data have been used to monitor changes could be classified into different categories based on
in land use, providing valuable insights for water resource the calculated slope value. A map of the slope of the
management, as studied before. 41,42 Understanding study area is based on an analysis of GIS data. Slope
LULC is important for hydrological and topographic analysis relies on a DEM to measure the change in
analyses in drainage basins, as it affects runoff, elevation across, while bodies or regions with very low
groundwater recharge, and water quality. For example, slope values were represented by dark blue to purple.
deforestation increases erosion, harming water quality In addition, places with a moderate slope are indicated
and reducing the basin’s storage capacity. LULC by yellow to orange hues, whereas areas with a high
43
analysis also helps identify optimal areas for rainwater slope are indicated by red. The light blue to green
45
collection and storage, which promotes effective water color indicates areas with low slopes. The terrain is
Digital Flow Flow
elevation Fill tool direction accumulation Conditional Contour
model tool tool
layer tool tool
Stream
Stream to
order feature Basin Pour Watershed Hydrological
tool tool point tool tool map
(raster) tool
(vector)
Figure 6. The flowchart of hydrological analysis
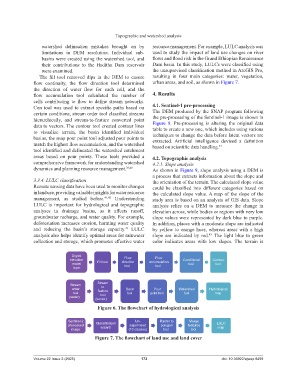
Sentinel-2 Un- Raster to Merge
processed Classification supervised polygon features LULC
image wizard (10 classes) tool tool map
Figure 7. The flowchart of land use and land cover
Volume 22 Issue 2 (2025) 173 doi: 10.36922/ajwep.8499