
Page 182 - AJWEP-v22i2
P. 182
Ali and Al-Hasnawi
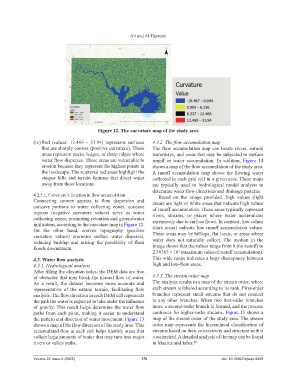
Figure 12. The curvature map of the study area
(iv) Red (values: 12.469 – 31.94) represents surfaces 4.3.2. The flow accumulation map
that are sharply convex (positive curvature). These The flow accumulation map can locate rivers, natural
areas represent peaks, ledges, or sharp ridges where waterways, and areas that may be subjected to surface
water flow disperses. These areas are vulnerable to runoff or water accumulation. In addition, Figure 14
erosion because they represent the highest points in shows a map of the flow accumulation of the study area.
the landscape. The scattered red areas highlight the A runoff accumulation map shows the flowing water
steeper hills and terrain features that direct water collected in each grid cell in a given area. These maps
away from these locations. are typically used in hydrological model analysis to
determine water flow directions and drainage patterns.
4.2.5.1. Curvature’s function in flow accumulation Based on the image provided, high values (light
Connecting convex aspects to flow dispersion and areas) are light or white areas that indicate high values
concave portions to water collecting zones, concave of runoff accumulation. These areas typically represent
regions (negative curvature values) serve as water rivers, streams, or places where water accumulates
collecting zones, promoting retention and groundwater extensively due to surface flows. In contrast, low values
infiltration, according to the curvature map in Figure 12.
On the other hand, convex topography (positive (dark areas) indicate low runoff accumulation values.
curvature values) promotes surface water dispersal, These areas may be hilltops, flat lands, or areas where
reducing buildup and raising the possibility of flash water does not naturally collect. The median in the
floods downstream. image shows that the values range from 0 (no runoff) to
2.39383 × 10⁷ (maximum value of runoff accumulation).
4.3. Water flow analysis This wide range indicates a large discrepancy between
4.3.1. Hydrological analysis high and low-flow areas.
After filling the elevation holes, the DEM data are free
of obstacles that may block the natural flow of water. 4.3.3. The stream order map
As a result, the dataset becomes more accurate and The analysis results in a map of the stream order, where
representative of the natural terrain, facilitating flow each stream is labeled according to its rank. First-order
analysis. The flow direction in each DEM cell represents branches represent small streams that do not connect
the path the water is expected to take under the influence to any other branches. When two first-order branches
of gravity. This result helps determine the water flow meet, a second-order branch is formed, and the process
paths from each point, making it easier to understand continues for higher-order streams. Figure 15 shows a
the pattern and direction of water movement. Figure 13 map of the stream order of the study area. The stream
shows a map of the flow direction of the study area. This order map represents the hierarchical classification of
accumulated flow at each cell helps identify areas that streams based on their connectivity and structure within
collect large amounts of water that may turn into major a watershed. A detailed analysis of the map can be found
rivers or valley paths. in Maarez and Jaber. 48
Volume 22 Issue 2 (2025) 176 doi: 10.36922/ajwep.8499