
Page 180 - AJWEP-v22i2
P. 180
Ali and Al-Hasnawi
flatter when the slope value is lower and steeper when shaded areas, indicating low illumination, often due to
the slope value is higher. steep terrain facing away from the light source. The
three-dimensional shadow map shows that it is used to
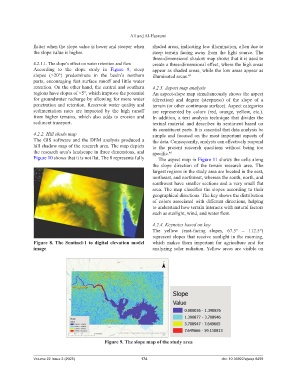
4.2.1.1. The slope’s effect on water retention and flow create a three-dimensional effect, where the high areas
According to the slope study in Figure 9, steep appear as shaded areas, while the low areas appear as
slopes (>20°) predominate in the basin’s northern illuminated areas. 45
parts, encouraging fast surface runoff and little water
retention. On the other hand, the central and southern 4.2.3. Aspect map analysis
regions have slopes of <5°, which improve the potential An aspect-slope map simultaneously shows the aspect
for groundwater recharge by allowing for more water (direction) and degree (steepness) of the slope of a
penetration and retention. Reservoir water quality and terrain (or other continuous surface). Aspect categories
sedimentation rates are impacted by the high runoff are represented by colors (red, orange, yellow, etc.).
from higher terrains, which also adds to erosion and In addition, a text analysis technique that divides the
sediment transport. textual material and describes its sentiment based on
its constituent parts. It is essential that data analysis be
4.2.2. Hill shade map simple and focused on the most important aspects of
The GIS software and the DEM analysis produced a the data. Consequently, analysts can effectively respond
hill shadow map of the research area. The map depicts to the present research questions without being too
the research area’s landscape in three dimensions, and specific. 46
Figure 10 shows that it is not flat. The 0 represents fully The aspect map in Figure 11 shows the cells along
the slope direction of the terrain research area. The
largest regions in the study area are located in the east,
northeast, and northwest, whereas the south, north, and
southwest have smaller sections and a very small flat
area. The map classifies the slopes according to their
geographical directions. The key shows the distribution
of colors associated with different directions, helping
to understand how terrain interacts with natural factors
such as sunlight, wind, and water flow.
4.2.4. Keynotes based on key
The yellow (east-facing slopes, 67.5° – 112.5°)
represent slopes that receive sunlight in the morning,
Figure 8. The Sentinel-1 to digital elevation model which makes them important for agriculture and for
image analyzing solar radiation. Yellow areas are visible on
Figure 9. The slope map of the study area
Volume 22 Issue 2 (2025) 174 doi: 10.36922/ajwep.8499