
Page 184 - AJWEP-v22i2
P. 184
Ali and Al-Hasnawi
(ii) Water-way network patterns. The dendritic pattern aquariums, with each aquarium assigned a unique color
shows a network that follows a tree pattern, and grid code. The legend in the image refers to the grid
common in areas with homogeneous geology and symbols representing basins or sub-regions. Geographic
topography. This style promotes efficient water features are also highlighted, with large basins (such as
flow. Geometric patterns indicate areas that show the area in purple or green) representing major basins
straight or angular patterns, which may indicate with extensive drainage. In contrast, small basins (such
geological influences such as faults or rock layers. as in pink or cyan) represent smaller sub-basins. Several
(iii) Color representation of ranks. The map uses color key points can be highlighted in the watershed basin
coding to represent different stream ranks. Pink map analysis:
color (first order) represents the smallest branches (i) Definition of water basins. The image contains
that form the basis of the drainage network, while multiple water basins extracted using flow
colors from green to yellow (ranks 2 – 5) represent direction and flow accumulation data. The apparent
the intermediate ranks where the sewage pool boundaries define hydrological breaks, with water
begins. Blue to brown colors (ranks 6 – 8) represent flowing within each basin based on topography.
major channels and larger rivers. (ii) Distribution of basin sizes. Large basins may
(iv) Rank distribution. Moving from lower to higher indicate areas with less steep terrain or areas where
ranks shows water accumulation in the landscape, several small basins are clustered. Small ponds are
from highlands to plains. The lower ranks (pink) are frequently found in areas with local drainage or
more evenly distributed, while the higher ranks (blue steep terrain.
and brown) are concentrated in valleys or plains. (iii) Structural relationships between basins. Based
(v) Hydrological insights. These insights can be further on the picture, there is a gradation in the sizes
classified into three parameters. One of these of the basins, where large basins may contain
parameters is discharge density, which indicates several smaller sub-basins. This structure can be
that a high density of first-order streams suggests used in multi-scale hydrological studies such as
high discharge. This typically reflects an area flood management or water resources planning.
with high rainfall rates or impermeable surfaces. Ponds of the same color in the picture represent
Second, hydrological connection indicates that separate watersheds or sub-basins. Each color
higher-order sewer connectivity promotes efficient indicates a unique watershed identified using flow
water transport, reducing the risk of local flooding. accumulation and direction data. These basins are
Finally, the map can help identify water basins. The separated by water dividing lines, meaning all water
map can define sub-basin boundaries, with higher- within the one-colored area flows toward the same
order streams defining the primary boundaries. outlet or meeting point.
(iv) Contributions of watersheds and sub-basins
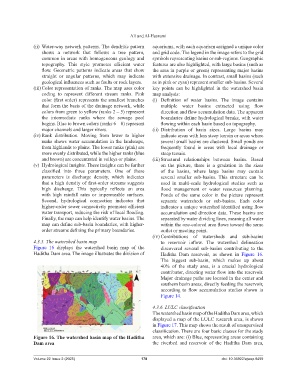
4.3.5. The watershed basin map to reservoir inflow. The watershed delineation
Figure 16 displays the watershed basin map of the discovered several sub-basins contributing to the
Haditha Dam area. The image illustrates the division of Haditha Dam reservoir, as shown in Figure 16.
The biggest sub-basin, which makes up about
40% of the study area, is a crucial hydrological
contributor, directing water flow into the reservoir.
Major drainage paths are located in the center and
southern basin areas, directly feeding the reservoir,
according to flow accumulation studies shown in
Figure 14.
4.3.6. LULC classification
The watershed basin map of the Haditha Dam area, which
displayed a map of the LULC research area, is shown
in Figure 17. This map shows the result of unsupervised
classification. There are four basic classes for the study
Figure 16. The watershed basin map of the Haditha area, which are: (i) Blue, representing areas containing
Dam area the riverbed and reservoir of the Haditha Dam area,
Volume 22 Issue 2 (2025) 178 doi: 10.36922/ajwep.8499