
Page 134 - AJWEP-v22i3
P. 134
Fuladipanah, et al.
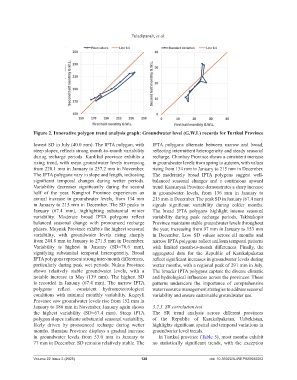
Figure 2. Innovative polygon trend analysis graph: Groundwater level (G.W.L) records for Turtkul Province
lowest SD in July (40.0 mm). The IPTA polygon, with IPTA polygons alternate between narrow and broad,
steep slopes, reflects strong month-to-month variability reflecting intermittent heterogeneity and steady seasonal
during recharge periods. Kanlikul province exhibits a recharge. Chimbay Province shows a consistent increase
rising trend, with mean groundwater levels increasing in groundwater levels from spring to autumn, with values
from 220.1 mm in January to 257.2 mm in November. rising from 134 mm in January to 215 mm in December.
The IPTA polygons vary in slope and length, indicating The moderately broad IPTA polygons suggest well-
significant temporal changes during wetter periods. balanced seasonal changes and a continuous upward
Variability decreases significantly during the second trend. Karauzyak Province demonstrates a sharp increase
half of the year. Kungirot Province experiences an in groundwater levels, from 136 mm in January to
annual increase in groundwater levels, from 134 mm 215 mm in December. The peak SD in January (67.4 mm)
in January to 215 mm in December. The SD peaks in signals significant variability during colder months.
January (67.4 mm), highlighting substantial winter The broad IPTA polygons highlight intense seasonal
variability. Moderate broad IPTA polygons reflect variability during peak recharge periods. Takhtakopir
balanced seasonal change with pronounced recharge Province maintains stable groundwater levels throughout
phases. Muynak Province exhibits the highest seasonal the year, increasing from 97 mm in January to 153 mm
variability, with groundwater levels rising sharply in December. Low SD values across all months and
from 244.8 mm in January to 271.5 mm in December. narrow IPTA polygons reflect uniform temporal patterns
Variability is highest in January (SD=78.6 mm), with limited month-to-month differences. Finally, the
signifying substantial temporal heterogeneity. Broad aggregated data for the Republic of Karakalpakstan
IPTA polygons represent strong inter-month differences, reflect significant increases in groundwater levels during
particularly during peak wet periods. Nukus Province wetter months, with a regional peak of 291 mm in July.
shows relatively stable groundwater levels, with a The broader IPTA polygons capture the diverse climatic
notable increase in May (139 mm). The highest SD and hydrological influences across the provinces. These
is recorded in January (67.4 mm). The narrow IPTA patterns underscore the importance of comprehensive
polygons reflect consistent hydrometeorological water resource management strategies to address seasonal
conditions with minimal monthly variability. Kegeyli variability and ensure sustainable groundwater use.
Province saw groundwater levels rise from 152 mm in
January to 186 mm in November. January again shows 3.2.3. SR correlation test
the highest variability (SD=67.4 mm). Steep IPTA The SR trend analysis across different provinces
polygon slopes indicate substantial seasonal variability, of the Republic of Karakalpakstan, Uzbekistan,
likely driven by pronounced recharge during wetter highlights significant spatial and temporal variations in
months. Buzatau Province displays a gradual increase groundwater level trends.
in groundwater levels from 53.0 mm in January to In Turtkul province (Table 5), most months exhibit
77 mm in December. SD remains relatively stable. The no statistically significant trends, with the exception
Volume 22 Issue 3 (2025) 128 doi: 10.36922/AJWEP025080052