
Page 133 - AJWEP-v22i3
P. 133
Groundwater trends in Karakalpakstan
patterns for each province in the Republic of
December 228.5 214.4 25.2 24.1 December– January 24.9 0.2 5.7 8.4 Karakalpakstan, Uzbekistan, enriched by specific
numerical and graphical representations.
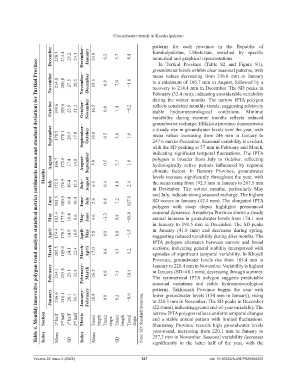
Table 4. Monthly innovative polygon trend analysis statistical metrics (arithmetic mean and standard deviation) for Turtkul Province
In Turtkul Province (Table S2 and Figure S1),
groundwater levels exhibit clear seasonal patterns, with
mean values decreasing from 236.6 mm in January
November 214.0 200.8 27.5 20.5 November– December 19.3 0.9 7.0 −1.6 to a minimum of 166.7 mm in August, followed by a
recovery to 214.4 mm in December. The SD peaks in
February (32.4 mm), indicating considerable variability
October 199.6 189.6 23.9 21.2 October– November 16.5 0.8 7.4 −0.2 during the winter months. The narrow IPTA polygon
reflects consistent monthly trends, suggesting relatively
stable hydrometeorological conditions. Minimal
variability during summer months reflects reduced
groundwater recharge. Ellikkala province demonstrates
September 178.5 178.1 20.5 17.8 September– October 10.0 0.5 3.8 1.0 mean values increasing from 246 mm in January to
a steady rise in groundwater levels over the year, with
247.6 mm in December. Seasonal variability is evident,
with the SD peaking at 57 mm in February and March,
polygon is broader from July to October, reflecting
August 166.7 172.6 17.4 14.8 August– September 5.9 0.5 3.7 1.0 indicating significant temporal fluctuations. The IPTA
hydrologically active periods influenced by regional
Months July 172.5 174.9 16.4 12.3 July– August 6.3 0.4 4.8 2.4 climatic factors. In Beruniy Province, groundwater
levels increase significantly throughout the year, with
the mean rising from 192.5 mm in January to 207.5 mm
in December. The wettest months, particularly May
and July, indicate strong seasonal recharge. The highest
June 181.5 180.5 16.4 10.4 June– July 2.6 0.6 7.2 127.1 SD occurs in January (42.4 mm). The elongated IPTA
polygon with steep slopes highlights pronounced
May 182.4 177.9 16.4 8.6 May– June 4.6 −3.2 9.8 −98.0 seasonal dynamics. Amudarya Province shows a steady
annual increase in groundwater levels from 174.1 mm
in January to 191.5 mm in December. The SD peaks
April 174.4 170.7 14.9 10.9 April– May 5.8 0.9 8.8 −1.5 in January (41.9 mm) and decreases during spring,
suggesting reduced variability during drier months. The
IPTA polygon alternates between narrow and broad
March 205.5 189.0 24.1 22.4 March– April 17.0 0.6 4.3 1.2 sections, indicating general stability interspersed with
episodes of significant temporal variability. In Khojeli
Province, groundwater levels rise from 185.4 mm in
February 234.1 213.8 25.1 32.4 February– March 26.2 0.9 7.5 10.4 January to 228.4 mm in November. Variability is highest
in January (SD=48.1 mm), decreasing through summer.
The symmetrical IPTA polygon suggests predictable
seasonal variations and stable hydrometeorological
January 236.6 216.1 26.1 31.7 January– February 28.9 0.9 9.2 −0.6 patterns. Takhiatash Province begins the year with
lower groundwater levels (154 mm in January), rising
to 224.3 mm in November. The SD peaks in December
(22.0 mm), indicating greater end-of-year variability. The
Section 1 st half 2 nd half 1 st half 2 nd half Metric Trend length Trend slope Trend length Trend slope Note: SD: Standard deviation. narrow IPTA polygon reflects uniform temporal changes
and a stable annual pattern with limited fluctuations.
Shumanay Province records high groundwater levels
Index Mean SD Index Mean SD year-round, increasing from 220.1 mm in January to
257.2 mm in November. Seasonal variability decreases
significantly in the latter half of the year, with the
Volume 22 Issue 3 (2025) 127 doi: 10.36922/AJWEP025080052