
Page 132 - AJWEP-v22i3
P. 132
Fuladipanah, et al.
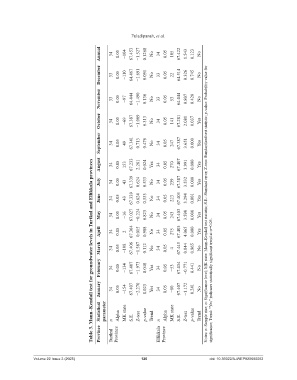
Annual 34 0.05 −104 67.453 −1.527 0.1268 No 34 0.05 105 67.422 1.543 0.123 No
December 33 0.05 −110 64.467 −1.691 0.091 No 33 0.05 22 64.514 0.326 0.745 No
November 33 0.05 −97 64.444 −1.490 0.136 No 33 0.05 53 64.444 0.807 0.420 No
October 34 0.05 −69 67.387 −1.009 0.313 No 34 0.05 141 67.281 2.081 0.037 Yes
September 34 0.05 49 67.341 0.713 0.476 No 34 0.05 247 67.387 3.651 0.000 Yes
August 34 0.05 153 67.233 2.261 0.024 Yes 34 0.05 270 67.407 3.991 0.000 Yes
Table 3. Mann–Kendall test for groundwater levels in Turtkul and Ellikkala provinces
July 34 0.05 43 67.339 0.624 0.533 No 34 0.05 239 67.387 3.532 0.000 Yes
June 34 0.05 43 67.339 0.624 0.533 No 34 0.05 223 67.403 3.294 0.001 Yes Notes: n: Sample size; α: Significance level; MK state: Mann–Kendall test statistic; S.E.: Standard error; Z-test: Standardized test statistic; p-value: Probability value for
May 34 0.05 −16 67.027 −0.224 0.823 No 34 0.05 243 67.403 3.590 0.000 Yes
April 34 0.05 2 67.364 0.015 0.988 No 34 0.05 275 67.403 4.065 0.000 Yes
March 34 0.05 −108 67.406 −1.587 0.112 No 34 0.05 4 67.445 0.044 0.965 No
February 34 0.05 −134 67.407 −1.973 0.048 Yes 34 0.05 −53 67.434 −0.771 0.441 No
January 34 0.05 −154 67.407 −2.270 0.023 Yes 34 0.05 −80 67.407 −1.172 0.241 No significance; Trend: “Yes” indicates statistically significant trend at α=0.05.
Statistical parameter n Alpha MK state S.E. Z-test p-value Trend n Alpha MK state S.E. Z-test p-value Trend
Province Turtkul Province Ellikkala Province
Volume 22 Issue 3 (2025) 126 doi: 10.36922/AJWEP025080052