
Page 21 - AN-1-3
P. 21
Advanced Neurology Early inhibition of PDK1 prevents AD-like pathology
(Figure 2A and B). Second, quantitative results revealed the Pdk1 cKO/5×FAD cortex, we performed IHC for Iba1
significant reductions in the average number of plaques in the using brain sections from mice at 2.5, 4, and 6 months.
Pdk1 cKO/5×FAD cortex at 2.5, 4, and 6 months compared to First, Iba1 cortical immunoreactivity did not differ
that in 5×FAD (Figure 2C; P < 0.001 at 2.5 months, P < 0.01 between the control and Pdk1 cKO mice at each age tested
at 4 months, and P < 0.001 at 6 months). Indeed, amyloid (Figure 3A). However, it was increased in the 5×FAD group
plaques were hardly seen in the Pdk1 cKO/5×FAD cortex at 2.5, 4, and 6 months compared with the control group
(Figure 2A–C). The results suggest that PDK1 deletion may (Figure 3A and 3B). Second, the average number of Iba1+
prevent plaque deposition in APP Tg mice. cells was significantly higher in the 5×FAD cortex than in
the control at 2.5, 4, and 6 months (Figure 3C; P < 0.001),
3.3. Gliosis is alleviated in 5×FAD mice with PDK1 but it was significantly lower in the Pdk1 cKO/5×FAD
deficiency group at 4 and 6 months compared with the 5×FAD group
Neuroinflammation is a typical feature in mouse models (Figure 3C; P < 0.001). These data suggest that PDK1
of AD [30,48] . To investigate whether microglia are affected in deletion may ameliorate microgliosis in APP Tg mice.
A
B C
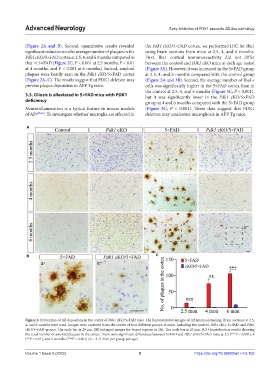
Figure 2. Prevention of Aβ deposition in the cortex of Pdk1 cKO/5×FAD mice. (A) Representative images of Aβ immunostaining. Brain sections at 2.5,
4, and 6 months were used. Images were captured from the cortex of four different groups of mice, including the control, Pdk1 cKO, 5×FAD, and Pdk1
cKO/5×FAD groups. The scale bar is 20 μm. (B) Enlarged images for boxed regions in (A). The scale bar is 25 μm. (C) Quantification results showing
the total number of amyloid plaques in the cortex. There were significant differences between 5×FAD and Pdk1 cKO/5×FAD mice at 2.5 (***P < 0.001), 4
(**P < 0.01), and 6 months (***P < 0.001) (n = 3–5 mice per group per age).
Volume 1 Issue 3 (2022) 5 https://doi.org/10.36922/an.v1i3.153