
Page 19 - AN-1-3
P. 19
Advanced Neurology Early inhibition of PDK1 prevents AD-like pathology
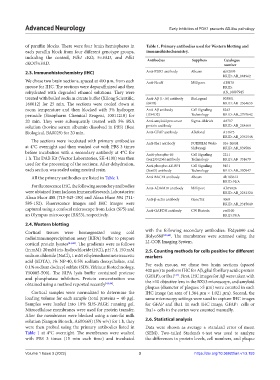
of paraffin blocks. There were four brain hemispheres in Table 1. Primary antibodies used for Western blotting and
each paraffin block from four different genotype groups, immunohistochemistry.
including the control, Pdk1 cKO, 5×FAD, and Pdk1 Antibodies Suppliers Catalogue
cKO/5×FAD. number
2.3. Immunohistochemistry (IHC) Anti-PDK1 antibody Abcam ab52893
RRID: AB_881962
We chose two brain sections, spaced at 400 μm, from each Anti-NeuN Millipore ABN78
mouse for IHC. The sections were deparaffinized and then RRID:
rehydrated with degraded ethanol solutions. They were AB_10807945
treated with boiled sodium citrate buffer (Xilong Scientific, Anti-Aβ (1-16) antibody BioLegend 803001
160012) for 25 min. The sections were cooled down at (6E10) RRID: AB_2564653
room temperature and then blocked with 3% hydrogen Anti-Aβ antibody Cell Signaling 8243
peroxide (Sinopharm Chemical Reagent, 10011218) for (D54D2) Technology RRID: AB_2797642
20 min. They were subsequently treated with 5% BSA Anti-amyloid precursor Sigma-Aldrich A8717
solution (bovine serum albumin dissolved in PBS) (Best protein antibody RRID: AB_258409
Biological, BA0029) for 20 min. Anti-GFAP antibody ABclonal A14673
RRID: AB_2761548
The sections were incubated with primary antibodies Anti-Iba1 antibody FUJIFILM Wako 016-20001
at 4°C overnight and then washed out with PBS 3 times Shibayagi RRID: AB_839506
before incubation with a secondary antibody at 4°C for Aniti-phospho-S6 Cell Signaling 2211
1 h. The DAB Kit (Vector Laboratories, SK-4100) was then (Ser235/236) antibody Technology RRID: AB_331679
used for the processing of the sections. After dehydration, Anti-phospho-4E-BP1 Cell Signaling 9451
each section was sealed using neutral resin. (Ser65) antibody Technology RRID: AB_330947
All the primary antibodies are listed in Table 1. Anti-BACE1 antibody Abcam Ab183612
RRID: N/A
For fluorescence IHC, the following secondary antibodies Anti-ADAM10 antibody Millipore AB19026
were obtained from Jackson ImmunoResearch Laboratories: RRID: AB_2242320
Alexa Fluor 488 (715-545-150) and Alexa Fluor 594 (711- Anti-β-actin antibody GeneTex 4060
585-152). Fluorescence images and IHC images were RRID: AB_2315049
captured using a confocal microscope from Leica (SP5) and Anti-GAPDH antibody CW Biotech cw0100
an Olympus microscope (BX53), respectively. RRID: N/A
2.4. Western blotting
Cortical tissues were homogenized using cold with the following secondary antibodies: IRdye800 and
[45,46]
radioimmunoprecipitation assay (RIPA) buffer to prepare IRdye680 . The membranes were scanned using the
cortical protein lysates [41,42] . The gradients were as follows LI-COR Imaging System.
(in mM): 20 mM tris-hydrochloride (HCl), pH 7.4, 150 mM 2.5. Counting methods for cells positive for different
sodium chloride (NaCl), 1 mM ethylenediaminetetraacetic markers
acid (EDTA), 1% NP-40, 0.5% sodium deoxycholate, and
0.1% sodium dodecyl sulfate (SDS, Yifeixue Biotechnology, For each mouse, we chose two brain sections (spaced
YS0005-500). The RIPA lysis buffer contained protease 400 μm) to perform IHC for Aβ, glial fibrillary acidic protein
[37]
and phosphatase inhibitors. Protein concentration was (GFAP), or Iba1 . First, IHC images for Aβ were taken with
obtained using a method reported recently [43,44] . the ×10 objective lens in the BX53 microscope, and amyloid
plaques (diameter of plaques >5 μm) were counted in each
Cortical samples were normalized to determine the IHC image (an area of 1.364 μm × 1.021 μm). Second, the
loading volume for each sample (total proteins = 40 μg). same microscopy settings were used to capture IHC images
Samples were loaded into 10% SDS-PAGE running gel. for GFAP and Iba1. In each IHC image, GFAP+ cells or
Nitrocellulose membranes were used for protein transfer. Iba1+ cells in the cortex were counted manually.
After the membranes were blocked using a non-fat milk
solution (Sangon Biotech, A600669) (5% w/v) for 1 h, they 2.6. Statistical analysis
were then probed using the primary antibodies listed in Data were shown as average ± standard error of mean
Table 1 at 4°C overnight. The membranes were washed (SEM). Two-tailed Student’s t-test was used to analyze
with PBS 3 times (15 min each time) and incubated the differences in protein levels, cell numbers, and plaque
Volume 1 Issue 3 (2022) 3 https://doi.org/10.36922/an.v1i3.153