
Page 93 - AN-2-2
P. 93
Advanced Neurology Brain AT -R and kidney crosstalk
1
A
B
C
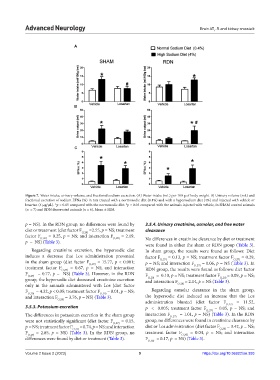
Figure 7. Water intake, urinary volume, and fractional sodium excretion. (A) Water intake (mL) per 100 g of body weight. B) Urinary volume (mL) and
fractional excretion of sodium EFNa (%) in rats treated with a normosodic diet (0.4%) and with a hypersodium diet (4%) and injected with vehicle or
losartan (4 µg/µL). *p < 0.05 compared with the normosodic diet. p < 0.05 compared with the animals injected with vehicle, in SHAM control animals
#
(n = 7) and RDN denervated animals (n = 6). Mean ± SEM.
p = NS). In the RDN group, no differences were found by 3.5.4. Urinary creatinine, osmolar, and free water
diet or treatment (diet factor F (1,20) =2.55, p = NS; treatment clearance
factor F (1,20) = 0.25, p = NS; and interaction F (1,20) = 2.19, No differences in creatinine clearance by diet or treatment
p = NS) (Table 3).
were found in either the sham or RDN group (Table 3).
Regarding creatinine excretion, the hypersodic diet In sham group, the results were found as follows: Diet
induces a decrease that Los administration prevented factor F = 0.13, p = NS; treatment factor F = 0.29,
(1,27)
(1,27)
in the sham group (diet factor F (1,27) = 15.77, p < 0.001; p = NS; and interaction F = 0.06, p = NS (Table 3). In
(1,27)
treatment factor F (1,27) = 0.67, p = NS; and interaction RDN group, the results were found as follows: diet factor
F (1,27) = 0.77, p = NS) (Table 3). However, in the RDN F = 0.10, p = NS; treatment factor F = 0.09, p = NS;
(1,20)
(1,20)
group, the hypersodic diet decreased creatinine excretion and interaction F = 2.14, p = NS (Table 3).
only in the animals administered with Los (diet factor (1,20)
F (1,20) = 4.32, p < 0.05; treatment factor F (1,20) = 0.01, p = NS; Regarding osmolar clearance in the sham group,
and interaction F (1,20) = 3.76, p = NS) (Table 3). the hypersodic diet induced an increase that the Los
administration blunted (diet factor F = 11.52,
(1,27)
3.5.3. Potassium excretion p < 0.005; treatment factor F (1,27) = 0.05, p = NS; and
The differences in potassium excretion in the sham group interaction F (1,27) = 1.01, p = NS) (Table 3). In the RDN
were not statistically significant (diet factor F (1,27) = 0.15, group, no differences were found in creatinine clearance by
p = NS; treatment factor F (1,27) = 0.74, p = NS; and interaction diet or Los administration (diet factor F (1,20) = 3.42, p = NS;
F (1,27) = 2.85, p = NS) (Table 3). In the RDN group, no treatment factor F (1,20) = 0.04, p = NS; and interaction
differences were found by diet or treatment (Table 3). F (1,20) = 0.17, p = NS) (Table 3).
Volume 2 Issue 2 (2023) 9 https://doi.org/10.36922/an.393