
Page 89 - AN-2-2
P. 89
Advanced Neurology Brain AT -R and kidney crosstalk
1
with diaminobenzidine hydrochloride, which produces area (corresponding to ×200 magnification). Since nuclei
a brown reaction product. Finally, they were mounted size and section thickness did not change between the
on gelatinized slides, air-dried overnight, dehydrated, experimental and control groups, any systematic error
cleared in xylene, and placed under a coverslip with DPX could be identical for all groups. The counting was made
mounting medium (Flucka Analytical). by two operators on each section analyzed to ensure that
2.7.2. Cytoarchitectural and quantitative analysis the number of profiles obtained was similar, but only
one counting was used. Counting of c-Fos-IR and c-Fos-
Images containing c-Fos-IR nuclei and c-Fos-AVP-IR were AVP-IR cells was performed blinded to the observer.
obtained using a computerized system that included a
Leica DM 4000B microscope equipped with a DFC Leica 2.8. Statistical analysis
digital camera attached to a contrast enhancement device. The experiments were designed to evaluate the brain
The brain nuclei evidencing c-Fos-IR were identified and AT -R role in renal function through SNS under two
1
delimited according to the atlas of Paxinos and Watson . independent conditions: sham or renal denervation. The
[26]
The numbers of c-Fos-IR nuclear profiles in the sections data were reported as mean ± SEM and analyzed using
were counted at a tone level; the distance from the bregma of two-way ANOVA considering the following factors: Diet
the corresponding plates is as follows: for the dorsomedial (normosodic/hypersodic) and treatment (Los/vehicle)
region of PVN = −0.92 mm, SON = −1.30 mm, SFO and followed by post hoc analysis Student-Newman Keuls in
OVLT = −1.40 mm. The number of c-Fos-AVP-IR neurons each condition. p < 0.05 was considered significant. The
was counted in SON = −1.30 mm. The image analysis was analyses were performed by using GraphPad Prism 6.03
®
accomplished using ImageJ software from the National software.
Institutes of Health (NIH). The threshold was fixed
between intervals of 0–150 in black-and-white conditions; 3. Results
all higher values were considered background. C-Fos-IR
neurons were identified by the dense black nucleus and 3.1. c-Fos-IR expression
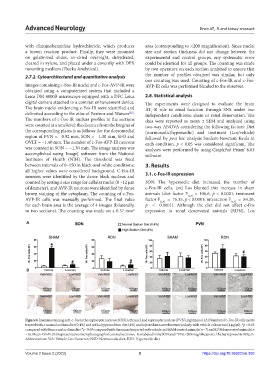
counted by setting a size range for cellular nuclei (8 –12 µm SON: The hypersodic diet increased the number of
of diameter), and AVP-IR neurons were identified by dense c-Fos-IR cells, and Los blunted this increase in sham
brown staining of the cytoplasm. The counting of c-Fos- animals (diet factor F (1,9) = 106.6, p < 0.0001; treatment
AVP-IR cells was manually performed. The final value factor F (1,9) = 76.35, p < 0.0001; interaction F (1,9) = 84.20,
for each brain area is the average of 4 images (bilaterally, p < 0.0001). Although the diet did not affect c-Fos
in two sections). The counting was made on a 0.37 mm expression in renal denervated animals (RDN), Los
2
A
B
Figure 4. Immunostaining anti-c-Fos in the supraoptic nucleus (SON), left panel, and supraoptic nucleus (PVN), right panel. (A) Number of c-Fos-IR cells in rats
treated with a normal sodium diet (0.4%) and with a hypersodium diet (4%) and injected intracerebroventricularly with vehicle or losartan (4 µg/µl). *p < 0.05
compared with the normal sodium diet. p < 0.05 compared with the animals injected with vehicle, in SHAM control animals (n = 7) and RDN denervated animals (n
#
= 6). Mean ± SEM. (B) Representative microphotograph of coronal sections c-Fos labeled in the SON and PVN (×200 magnification). The bar represents 100 µm.
Abbreviations: Veh: Vehicle; Los: Losartan; NSD: Normosodic diet; HSD: Hypersodic diet.
Volume 2 Issue 2 (2023) 5 https://doi.org/10.36922/an.393