
Page 91 - AN-2-2
P. 91
Advanced Neurology Brain AT -R and kidney crosstalk
1
Sodium intake was high in animals exposed to a treatment factor F (1,27) = 0.76, p = NS; and interaction
hypersodic diet in sham and RDN groups, and Los did F (1,27) = 0.22, p = NS (Table 2). In RDN group, the results
not modify it. For sham group, the results were found as were found as follows: Diet factor F (1,20) = 0.17 p = NS;
follows: Diet factor F (1,27) = 201.90, p < 0.0001; treatment treatment factor F (1,20) = 1.63 p = NS; and interaction
factor F (1,27) = 0.20, p = NS; and interaction F (1,27) = 0.54, F (1,20) = 2.45 p = NS (Table 2).
p = NS (Table 1). For RDN group, the results were found Concerning plasma creatinine, in sham group, the
as follows: Diet factor F (1,20) = 99.77, p < 0.0001; treatment results were found as follows: Diet factor F = 0.028,
(1,27)
factor F (1,20) = 0.02, p = NS; and interaction F (1,20) = 0.08, p = NS; treatment factor F = 1.62, p = NS; and interaction
(1,27)
p = NS (Table 1). F = 0.11, p = NS (Table 2). In RDN group, the results
(1,27)
No differences in potassium intake induced by diet or were found as follows: Diet factor F (1,20) = 0.41, p = NS;
treatment in either the sham or RDN group were found. treatment factor F (1,20) = 0.001, p = NS; and interaction
For sham group, the results were found as follows: Diet F (1,20) = 2.10, p = NS (Table 2).
factor F (1,27) = 0.27, p = NS; treatment factor F (1,27) = 0.27, Concerning plasma chlorine, in sham group, the results
p = NS; and interaction F (1,27) = 1.64, p = NS (Table 1). For were found as follows: Diet factor F = 2.16, p = NS;
(1,27)
RDN group, the results were found as follows: Diet factor treatment factor F = 0.50, p = NS; and interaction
(1,27)
F (1,20) = 0.06, p = NS; treatment factor F (1,20) = 0.06, p = NS; F = 0.01, p = NS (Table 2). In RDN group, the results
(1,27)
and interaction F (1,20) = 0.24, p = NS (Table 1). were found as follows: diet factor F (1,20) = 0.0009, p = NS;
treatment factor F = 0.58, p = NS; and interaction
3.4. Sodium, creatinine, chlorine, and potassium F = 0.44, p = NS (Table 2).
(1,20)
plasma levels (1,20)
Concerning plasma potassium, in sham group, the
No differences were found in these parameters by diet or results were found as follows: Diet factor F = 0.76,
treatment, either sham or RDN group. (1,27)
p = NS; treatment factor F (1,27) = 2.98, p = NS; and interaction
Concerning plasma sodium, in sham group, the results F (1,27) = 6.41, p = NS (Table 2). In RDN group, the results
were found as follows: Diet factor F (1,27) = 1.07, p = NS; were found as follows: Diet factor F (1,20) = 0.0002 p = NS;
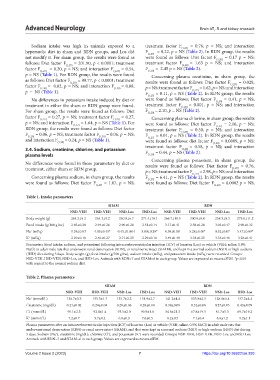
Table 1. Intake parameters
SHAM RDN
NSD‑VEH HSD‑VEH NSD‑Los HSD‑Los NSD‑VEH HSD‑VEH NSD‑Los HSD‑Los
Body weight (g) 264.3±9.2 264.3±9.2 260.0±6.7 271.4±10.1 266.7±10.5 300.0±0.0 258.3±8.3 275.0±11.2
Food intake (g/100 g bw) 2.43±0.28 2.94±0.26 2.90±0.20 2.51±0.14 3.17±0.41 2.58±0.20 3.03±0.47 2.90±0.32
Na (mEq) 0.38±0.03 4.09±0.45* 0.45±0.0.04 3.80±0.30* 0.58±0.08 5.28±0.40* 0.52±0.07 5.47±0.69*
+
K (mEq) 2.29±0.18 2.46±0.27 2.71±0.25 2.29±0.18 3.49±0.49 3.18±0.25 3.18±0.46 3.28±0.41
+
Parameters (food intake, sodium, and potassium) following intracerebroventricular injection (ICV) of losartan (Los) or vehicle (VEH; saline, 0.9%
NaCl) in adult male rats that underwent renal denervation (RDN), or renal nerve intact (SHAM), and kept in a normal sodium (NSD) or high-sodium
(HSD) diet during 5 days. Body weight (g), food intake (g/100 g bw), sodium intake (mEq), and potassium intake (mEq) were recorded. Groups:
NSD-VEH, HSD-VEH, NSD-Los, and HSD-Los. Animals with RDN=7 and SHAM=6 in each group. Values are expressed as means±SEM. *p<0.05
with respect to the normal sodium diet.
Table 2. Plasma parameters
SHAM RDN
NSD‑VEH HSD‑VEH NSD‑Los HSD‑Los NSD‑VEH HSD‑VEH NSD‑Los HSD‑Los
Na (mmol/L) 136.7±3.3 135.3±1.7 135.7±2.2 131.9±2.7 141.2±4.4 135.8±2.3 128.0±6.4 137.2±4.4
+
Creatinine (mg/dL) 0.21±0.02 0.24±0.04 0.29±0.06 0.28±0.04 0.38±0.09 0.32±0.06 0.27±0.05 0.43±0.09
Cl (mmol/L) 95.1±2.3 92.0±1.4 93.5±2.0 90.9±1.6 54.6±21.3 67.8±19.5 81.7±5.3 69.7±19.2
-
K (mmol/L) 7.2±0.7 5.7±0.2 6.9±0.3 7.6±0.5 8.2±0.5 7.1±0.4 8.6±1.2 9.2±1.1
+
Plasma parameters after an intracerebroventricular injection (ICV) of losartan (Los) or vehicle (VEH; saline, 0.9% NaCl) in adult male rats that
underwent renal denervation (RDN) or renal nerve intact (SHAM), and that were kept in a normal sodium (NSD) or high-sodium (HSD) diet during
5 days. Sodium (Na ), creatinine (mg/dL), chlorine (Cl ), and potassium (K ) were recorded. Groups: NSD-VEH, HSD-VEH, NSD-Los, and HSD-Los.
-
+
+
Animals with RDN=7 and SHAM=6 in each group. Values are expressed as means±SEM.
Volume 2 Issue 2 (2023) 7 https://doi.org/10.36922/an.393