
Page 90 - AN-2-2
P. 90
Advanced Neurology Brain AT -R and kidney crosstalk
1
decreased the number of Fos-IR cells (diet factor factor F (1,15) = 9.30, p < 0.05; treatment factor F (1,15) = 0.32,
F (1,14) = 0.11, p = not significant (NS); treatment factor p = NS; interaction F (1,15) = 0.41, p = NS) (Figure 5, right
F (1,14) = 4.81, p < 0.05; interaction F (1,14) = 0.74, p = NS) panel).
(Figure 4, left panel).
3.2. c-Fos-AVP-IR expression
PVN: In sham animals, no statistical differences were
found in c-Fos expression in diet factor, treatment factor, Hypersodic diet induced an increase in the number of
or interaction between both factors (diet factor F (1,24) = 0.04, c-Fos-AVP-IR cells in SON, and Los administration
p = NS; treatment factor F (1,24) = 0.001, p = NS; interaction prevented it (diet factor F (1,4) = 15.37, p < 0.05; treatment
F (1,24) = 0.30, p = NS). In the RDN group, Los decreased the factor F (1,4) = 6.94, p = NS; interaction F (1,4) =23.22, p < 0.01)
(Figure 6).
number of c-Fos-IR cells in animals with the hypersodic
diet)diet factor F (1,14) = 0.71, p =NS; treatment factor 3.3. Water, food, sodium, and potassium intake
F (1,14) = 5.63, p < 0.05; interaction F (1,14) = 1.34, p = NS)
(Figure 4, right panel). As expected, the hypersodic diet increased the water
intake in sham animals, and Los prevented it (diet factor
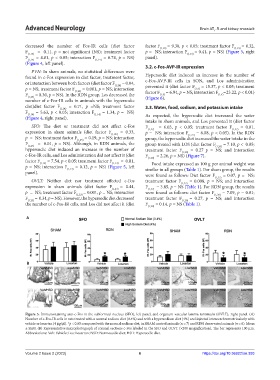
SFO: The diet or treatment did not affect c-Fos F = 6.03, p < 0.05; treatment factor F = 0.01,
(1,27)
(1,27)
expression in sham animals (diet factor F (1,25) = 0.33, p = NS; interaction F = 6.08, p < 0.05). In the RDN
(1,27)
p = NS; treatment factor F (1,25) = 0.19, p = NS; interaction group, the hypersodic diet increased the water intake in the
F (1,25) = 0.01, p = NS). Although, in RDN animals, the group treated with LOS (diet factor F = 7.10, p < 0.05;
(1,20)
hypersodic diet induced an increase in the number of treatment factor F (1,20) = 0.27 p = NS; and interaction
c-Fos-IR cells, and Los administration did not affect it (diet F = 2.26, p = NS) (Figure 7).
factor F (1,14) = 7.54, p < 0.05; treatment factor F (1,14) = 0.01, (1,20)
Food intake expressed as 100 g per animal weight was
p = NS; interaction F (1,14) = 0.12, p = NS) (Figure 5, left similar in all groups (Table 1). For sham group, the results
panel).
were found as follows: Diet factor F (1,27) = 0.07, p = NS;
OVLT: Neither diet nor treatment affected c-Fos treatment factor F (1,27) = 0.008, p = NS; and interaction
expression in sham animals (diet factor F (1,23) = 0.44, F (1,27) = 3.85, p = NS (Table 1). For RDN group, the results
p = NS; treatment factor F (1,23) = 0.001, p = NS; interaction were found as follows: diet factor F (1,20) = 7.09, p = 0.01;
F (1,23) = 0.34, p = NS). However, the hypersodic diet decreased treatment factor F (1,20) = 0.27, p = NS; and interaction
the number of c-Fos-IR cells, and Los did not affect it (diet F (1,20) = 0.14, p = NS (Table 1).
A
B
Figure 5. Immunostaining anti-c-Fos in the subfornical nucleus (SFO), left panel, and organum vascular lamina terminalis (OVLT), right panel. (A)
Number of c-Fos-IR cells in rats treated with a normal sodium diet (0.4%) and with a hypersodium diet (4%) and injected intracerebroventricularly with
vehicle or losartan (4 µg/µl). *p < 0.05 compared with the normal sodium diet, in SHAM control animals (n = 7) and RDN denervated animals (n = 6). Mean
± SEM. (B) Representative microphotograph of coronal sections c-Fos labeled in the SFO and OLVT (×200 magnification). The bar represents 100 µm.
Abbreviations: Veh: Vehicle; Los: Losartan; NSD: Normosodic diet; HSD: Hypersodic diet.
Volume 2 Issue 2 (2023) 6 https://doi.org/10.36922/an.393