
Page 92 - AN-2-2
P. 92
Advanced Neurology Brain AT -R and kidney crosstalk
1
treatment factor F (1,20) = 0.75, p = NS; and interaction 3.5. Biochemistry
F = 0.83, p = NS (Table 2).
(1,20)
3.5.1. Urinary volume and sodium excretion
A Regarding urinary volume, the increase induced by the
hypersodic diet was blunted with Los in the sham group
(diet factor F (1,27) = 36.83, p < 0.0001; treatment factor
F (1,27) = 24.16, p < 0.0001; and interaction F (1,27) = 2.00,
p = NS). In the RDN group, the hypersodic diet increased
the urinary volume in animals administered with LOS (diet
factor F (1,16) = 7.23, p < 0.05; treatment factor F (1,16) = 2.66,
p = NS; and interaction F = 3.97, p = NS) (Figure 7).
(1,16)
The sodium excretion in the sham group with a
B hypersodic diet was significantly high, and Los did not affect
it (diet factor F (1,27) = 35.42, p < 0.0001; treatment factor
F (1,27) = 0.34, p = NS; and interaction F (1,27) = 0.55, p = NS).
The same phenomenon was observed in the RDN group (diet
factor F (1,16) = 15.31, p < 0.001; treatment factor F (1,16) = 1.35,
p = NS; and interaction F = 1.39, p = NS) (Figure 7).
(1,16)
In the sham group, the hypersodic diet induced an
increase in sodium fractional excretion, and Los did not
affect it (diet factor F (1,27) = 36.83, p < 0.0001; treatment
factor F (1,27) = 0.24, p = NS; and interaction F (1,27) = 0.99,
p = NS). In the RDN group, the hypersodic diet increased
sodium fractional excretion in animals administered with
Los (diet factor F = 19.34, p < 0.005; treatment factor
(1,20)
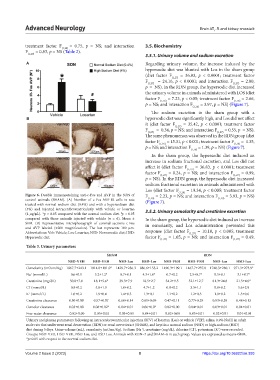
Figure 6. Double immunostaining anti-c-Fos and AVP in the SON of F = 2.23, p = NS; and interaction F = 3.93, p = NS)
(1,20)
control animals (SHAM). (A) Number of c-Fos-AVP-IR cells in rats (Figure 7). (1,20)
treated with normal sodium diet (0.4%) and with a hypersodium diet
(4%) and injected intracerebroventricularly with vehicle or losartan 3.5.2. Urinary osmolarity and creatinine excretion
(4 µg/µL). *p < 0.05 compared with the normal sodium diet. p < 0.05
#
compared with those animals injected with vehicle (n = 6). Mean ± In the sham group, the hypersodic diet induced an increase
SEM. (B) Representative microphotograph of coronal sections c-Fos in osmolarity, and Los administration prevented this
and AVP labeled (×200 magnification). The bar represents 100 µm.
Abbreviations: Veh: Vehicle; Los: Losartan; NSD: Normosodic diet; HSD: response (diet factor F (1,27) = 10.10, p < 0.005; treatment
Hypersodic diet. factor F (1,27) = 1.65, p = NS; and interaction F (1,27) = 0.49,
Table 3. Urinary parameters
SHAM RDN
NSD‑VEH HSD‑VEH NSD‑Los HSD‑Los NSD‑VEH HSD‑VEH NSD‑Los HSD‑Los
Osmolarity (mOsm/Kg) 1867.7±243.1 1014.0±181.0* 1429.7±236.3 886.6±153.2 1496.3±199.1 1467.7±237.8 1740.3±280.1 971.3±273.9*
Na (mmol/L) 0.6±0.1 5.2±1.2* 0.7±0.1 4.3±1.0* 0.7±0.2 2.5±0.7* 0.5±0.1 3.1±0.7*
+
Creatinine (mg/dL) 50.8±7.0 18.1±5.6* 39.3±7.9 18.5±2.7 54.2±9.5 52.1±12.7 81.3±24.8 21.5±4.0*
-
Cl (mmol/L) 0.9±0.2 5.8±1.3 1.0±0.2 4.7±1.2 0.9±0.2 3.5±1.1 0.8±0.2 5.6±2.9
K (mmol/L) 1.0±0.2 1.9±0.4 1.4±0.3 1.3±0.1 1.1±0.2 1.2±0.3 1.0±0.2 1.3±0.6
+
Creatinine clearance 0.50±0.09 0.57±0.07 0.60±0.14 0.61±0.09 0.47±0.11 0.77±0.29 0.93±0.39 0.48±0.13
Osmolar clearance 0.03±0.00 0.08±0.02* 0.04±0.01 0.06±0.0* 0.02±0.00 0.04±0.01 0.03±0.01 0.04±0.01
Free water clearance -0.02±0.00 -0.05±0.02 -0.03±0.01 -0.04±0.01 -0.02±0.00 -0.03±0.01 -0.02±0.01 -0.01±0.01
Urinary and plasma parameters following an intracerebroventricular injection (ICV) of losartan (Los) or vehicle (VEH; saline, 0.9% NaCl) in adult
male rats that underwent renal denervation (RDN) or renal nerve intact (SHAM), and kept in a normal sodium (NSD) or high-sodium (HSD)
diet during 5 days. Urine volume (mL), osmolarity (mOsm/Kg). Sodium (Na ), creatinine (mg/dL), chlorine (Cl ), potassium (K ) were recorded.
+
+
-
Groups: NSD-VEH, HSD-VEH, NSD-Los, and HSD-Los. Animals with RDN=7 and SHAM=6 in each group. Values are expressed as means±SEM.
*p<0.05 with respect to the normal sodium diet.
Volume 2 Issue 2 (2023) 8 https://doi.org/10.36922/an.393