
Page 97 - AN-4-2
P. 97
Advanced Neurology PVT in Indonesian neurological patients
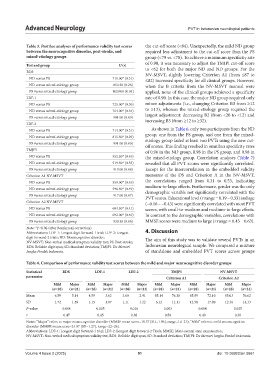
Table 3. Post hoc analyses of performance validity test scores the cut-off score (<84). Unexpectedly, the mild ND group
between the neurocognitive disorder, post‑stroke, and required less adjustment to the cut-off score than the PS
mixed‑etiology groups group (<79 vs. <78). To achieve a minimum specificity rate
Test and group U (r) of 0.90, it was necessary to adjust the TMJPI cut-off score
RDS to <62 for both the major ND and ND groups. For the
NV-MSVT, slightly lowering Criterion A1 (from ≤87 to
ND versus PS 711.00* (0.31) ≤82) increased specificity for all clinical groups. However,
ND versus mixed-etiology group 853.50 (0.26) when the B criteria from the NV-MSVT manual were
PS versus mixed-etiology group 1029.00 (0.04) applied, none of the clinical groups achieved a specificity
LDF-1 rate of 0.90. In this case, the major ND group required only
ND versus PS 725.00* (0.30) minor adjustments (i.e., changing Criterion B3 from ≥12
ND versus mixed-etiology group 764.00* (0.34) to ≥13), whereas the mixed-etiology group required the
PS versus mixed-etiology group 901.00 (0.09) largest adjustment: decreasing B2 (from <20 to <12) and
LDF-2 increasing B3 (from ≥12 to ≥32).
ND versus PS 714.00* (0.31) As shown in Table 6, only two participants from the ND
ND versus mixed-etiology group 815.50* (0.29) group, one from the PS group, and one from the mixed-
PS versus mixed-etiology group 991.00 (0.00) etiology group failed at least two PVTs using the new cut-
off scores. This finding resulted in omnibus specificity rates
TMJPI of 0.96 in the ND group, 0.98 in the PS group, and 0.98 in
ND versus PS 552.50* (0.46) the mixed-etiology group. Correlation analyses (Table 7)
ND versus mixed-etiology group 519.50* (0.55) revealed that all PVT scores were significantly correlated.
PS versus mixed-etiology group 910.00 (0.08) Except for the intercorrelation in the embedded validity
Criterion A1 NV-MSVT measures of the DS and Criterion A in the NV-MSVT,
ND versus PS 559.00* (0.46) the correlations ranged from 0.31 to 0.53, indicating
ND versus mixed-etiology group 590.50* (0.49) medium-to-large effects. Furthermore, gender was the only
demographic variable not significantly correlated with the
PS versus mixed-etiology group 917.00 (0.07) PVT scores. Educational level (r range = 0.19 – 0.33) and age
Criterion A2 NV-MSVT (−0.16 – −0.43) were significantly correlated with most PVT
ND versus PS 604.50* (0.41) scores, with small-to-medium and medium-to-large effects.
ND versus mixed-etiology group 692.00* (0.40) In contrast to the demographic variables, correlations with
PS versus mixed-etiology group 930.50 (0.06) MMSE scores were medium to large (r range = 0.43 – 0.63).
Note: *P<0.02 (after Bonferroni correction).
Abbreviations: LDF-1: Longest digit forward-1 trial; LDF-2: Longest 4. Discussion
digit forward-2 trials; ND: Neurocognitive disorder; The aim of this study was to validate several PVTs in an
NV-MSVT: Non-verbal medical symptom validity test; PS: Post-stroke;
RDS: Reliable digit span; SD: Standard deviation; TMJPI: Tes Memori Indonesian neurological sample. We compared a mixture
Jangka Pendek Indonesia. of standalone and embedded PVT scores across groups
Table 4. Comparison of performance validity test scores between the mild and major neurocognitive disorder groups
Statistical RDS LDF‑1 LDF‑2 TMJPI NV‑MSVT
parameter Criterion A1 Criterion A2
Mild Major Mild Major Mild Major Mild Major Mild Major Mild Major
(n=28) (n=21) (n=28) (n=21) (n=28) (n=21) (n=28) (n=21) (n=28) (n=21) (n=28) (n=21)
Mean 6.59 5.14 4.59 3.62 3.69 2.91 85.14 76.38 85.59 72.10 85.03 76.62
SD 1.72 1.59 1.15 1.07 1.11 1.22 6.12 11.11 12.58 17.00 12.36 14.33
P-value 0.004 0.005 0.016 0.003 0.004 0.025
r 0.47 0.45 0.38 0.50 0.49 0.38
Notes: “Major” refers to major neurocognitive disorder (MMSE mean score=18.57 [SD=1.96], range=14–21); “Mild” refers to mild neurocognitive
disorder (MMSE mean score=24.07 [SD=1.27], range=22–26).
Abbreviations: LDF-1: Longest digit forward-1 trial; LDF-2: Longest digit forward-2 Trials; MMSE: Mini-mental state examination;
NV-MSVT: Non-verbal medical symptom validity test; RDS: Reliable digit span; SD: Standard deviation; TMJPI: Tes Memori Jangka Pendek Indonesia.
Volume 4 Issue 2 (2025) 91 doi: 10.36922/an.5661