
Page 99 - AN-4-2
P. 99
Advanced Neurology PVT in Indonesian neurological patients
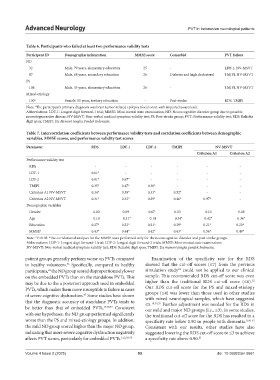
Table 6. Participants who failed at least two performance validity tests
Participant ID Demographic information MMSE score Comorbid PVT failure
ND
32 Male, 79 years, elementary education 25 - LDF-1, NV-MSVT
87 Male, 68 years, secondary education 26 Diabetes and high cholesterol TMJPI, NV-MSVT
PS
106 Male, 33 years, elementary education 26 - TMJPI, NV-MSVT
Mixed-etiology
130 a Female, 55 years, tertiary education - Post-stroke RDS, TMJPI
Note: The participant’s primary diagnosis was brain tumor-related epilepsy (focal onset with impaired awareness).
a
Abbreviations: LDF-1: Longest digit forward-1 trial; MMSE: Mini-mental state examination; ND: Neurocognitive disorder group due to possible
neurodegenerative disease; NV-MSVT: Non-verbal medical symptom validity test; PS: Post-stroke group; PVT: Performance validity test; RDS: Reliable
digit span; TMJPI: Tes Memori Jangka Pendek Indonesia.
Table 7. Intercorrelation coefficients between performance validity tests and correlation coefficients between demographic
variables, MMSE scores, and performance validity test scores
Parameter RDS LDF‑1 LDF‑2 TMJPI NV‑MSVT
Criterion A1 Criterion A2
Performance validity test
RDS - - - - - -
LDF-1 0.61* - - - - -
LDF-2 0.81* 0.67* - - - -
TMJPI 0.35* 0.47* 0.30* - - -
Criterion A1 NV-MSVT 0.34* 0.38* 0.33* 0.52* - -
Criterion A2 NV-MSVT 0.31* 0.32* 0.29* 0.46* 0.97* -
Demographic variables
Gender −0.03 0.09 0.07 0.03 −0.10 −0.08
Age −0.14 −0.31* −0.14 −0.34* −0.42* −0.36*
Education 0.27* 0.23* 0.21* 0.29* 0.21* 0.20*
MMSE a 0.43* 0.44* 0.42* 0.63* 0.56* 0.49*
Note: *P<0.05. The correlational analyses for the MMSE were performed only for the neurocognitive disorder and post-stroke groups.
a
Abbreviations: LDF-1: Longest digit forward-1 trial; LDF-2: Longest digit forward-2 trials; MMSE: Mini-mental state examination;
NV-MSVT: Non-verbal medical symptom validity test; RDS: Reliable digit span; TMJPI: Tes memori jangka pendek Indonesia.
patient groups generally perform worse on PVTs compared Examination of the specificity rate for the RDS
to healthy volunteers. Specifically, compared to healthy showed that the cut-off scores (≤7) from the previous
46
22
participants, the ND group scored disproportionately lower simulation study could not be applied to our clinical
22
on the embedded PVTs than on the standalone PVTs. This sample. This recommended RDS cut-off score was even
32
may be due to the a posteriori approach used in embedded higher than the traditional RDS cut-off score (≤6).
PVTs, which makes them more susceptible to failure in cases Our RDS cut-off score for the PS and mixed-etiology
of severe cognitive dysfunction. Some studies have shown groups (≤4) was lower than those used in other studies
47
that the diagnostic accuracy of standalone PVTs tends to with mixed neurological samples, which have suggested
≤5.
Further adjustment was needed for the RDS in
18,54,55
be better than that of embedded PVTs. 17,48,49 Consistent our mild and major ND groups (i.e., ≤3). In some studies,
with our hypotheses, the ND group performed significantly the traditional cut-off score for the RDS has resulted in a
worse than the PS and mixed-etiology groups. In addition, specificity rate below 0.90 in people with dementia. 9,50-52
the mild ND group scored higher than the major ND group, Consistent with our results, other studies have also
indicating that more severe cognitive dysfunction negatively suggested lowering the RDS cut-off score to ≤3 to achieve
affects PVT scores, particularly for embedded PVTs. 1,12,50-53 a specificity rate above 0.90. 21
Volume 4 Issue 2 (2025) 93 doi: 10.36922/an.5661