
Page 98 - AN-4-2
P. 98
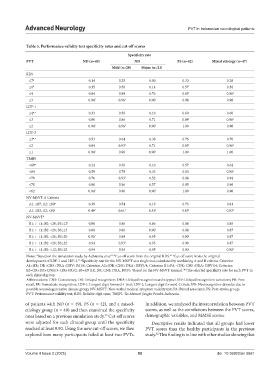
Advanced Neurology                                                   PVT in Indonesian neurological patients


            Table 5. Performance validity test specificity rates and cut‑off scores
                                                       Specificity rate
            PVT                     ND (n=49)             ND                PS (n=42)      Mixed etiology (n=47)
                                                 Mild (n=28)  Major (n=21)
            RDS
             ≤7 a                      0.14         0.25         0.00          0.33               0.28
             ≤6 b                      0.35         0.50         0.14          0.57               0.56
             ≤4                        0.84         0.89         0.76         0.93 f             0.96 f
             ≤3                        0.94 f      0.96 f       0.90 f         0.98               0.98
            LDF-1
             ≤4 a, c                   0.33         0.50         0.10          0.60               0.60
             ≤3                        0.80         0.86         0.71         0.98 f             0.96 f
             ≤2                        0.94 f      0.96 f       0.90 f         1.00               0.98
            LDF-2
             ≤3 a, c                   0.53         0.64         0.38          0.76               0.70
             ≤2                        0.84        0.93 f        0.71         0.93 f             0.96 f
             ≤1                        0.94 f       0.96        0.90 f         1.00               1.00
            TMJPI
             <89 a                     0.24         0.36         0.10          0.57               0.64
             <84                       0.59         0.79         0.33          0.83              0.91 f
             <79                       0.76        0.93 f        0.52          0.88               0.94
             <78                       0.80         0.96         0.57          0.95               0.96
             <62                       0.94 f       0.96        0.90 f         1.00               0.98
            NV-MSVT A Criteria
             A1: ≤87; A2: ≤80 a        0.39         0.54         0.19          0.79               0.81
             A1: ≤82; A2: ≤80          0.49 f      0.61 f       0.33 f        0.83 f             0.83 f
            NV-MSVT d
             B1: >−11; B2: <20; B3≥12 e  0.86       0.86         0.86          0.88               0.85
             B1: >−11; B2: <20; B3≥13  0.88         0.86        0.90 f         0.88               0.87
             B1: >−11; B2: <20; B3≥20  0.92 f       0.89         0.95         0.90 f              0.87
             B1: >−11; B2: <20; B3≥22  0.94        0.93 f        0.95          0.90               0.87
             B1: >−11; B2: <12; B3≥32  0.94         0.93         0.95          0.93              0.91 f
            Notes:  Based on the simulation study by Adhiatma et al.   Cut-off score from the original RDS.   Cut-off score from the original
                 a
                                                                         32 c
                                                22 b
            development of LDF-1 and LDF-2.   Specificity rate for the NV-MSVT as a single test, calculated by combining A and B criteria. Criterion
                                  33 d
            A1=(IR+DR+CNS+DRA+DRV+PA)/6; Criterion A2=(DR+CNS+DRA+DRV)/4; Criterion B1=PA –(DR+CNS+DRA+DRV)/4; Criterion
            B2=(IR+DR+CNS)/3–(PA+FR)/2; B3=SD (IR, DR, CNS, DRA, DRV).  Based on the NV-MSVT manual.   The selected specificity rate for each PVT in
                                                                                26 f
                                                         e
            each clinical group.
            Abbreviations: CNS: Consistency; DR: Delayed recognition; DRA: Delayed recognition archetypes; DRV: Delayed recognition variations; FR: Free
            recall; IR: Immediate recognition; LDF-1: Longest digit forward-1 trial; LDF-2: Longest digit forward-2 trials; ND: Neurocognitive disorder due to
            possible neurodegenerative disease group; NV-MSVT: Non-verbal medical symptom validity test; PA: Paired associates; PS: Post-stroke group;
            PVT: Performance validity test; RDS: Reliable digit span; TMJPI: Tes Memori Jangka Pendek Indonesia.
            of patients with ND (n = 49), PS (n = 42), and a mixed-  In addition, we analyzed the intercorrelation between PVT
            etiology group (n = 49) and then examined the specificity   scores, as well as the correlations between the PVT scores,
            rates based on a previous simulation study.  Cut-off scores   demographic variables, and MMSE scores.
                                              22
            were adjusted for each clinical group until the specificity   Descriptive results indicated that all groups had lower
            reached at least 0.90. Using the new cut-off scores, we then   PVT scores than the healthy participants in the previous
            explored how many participants failed at least two PVTs.   study.  This finding is in line with other studies showing that
                                                                   22


            Volume 4 Issue 2 (2025)                         92                               doi: 10.36922/an.5661