
Page 108 - AN-4-3
P. 108
Advanced Neurology ADRD comorbidities and senescence
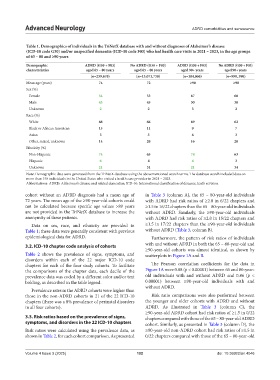
Table 1. Demographics of individuals in the TriNetX database with and without diagnoses of Alzheimer’s disease
(ICD‑10 code G30) and/or unspecified dementia (ICD‑10 code F03) who had health care visits in 2021 – 2023, in the age groups
of 65 – 80 and ≥90 years
Demographic ADRD (G30 + F03) No ADRD (G30 + F03) ADRD (G30 + F03) No ADRD (G30 + F03)
characteristics aged 65 – 80 years aged 65 – 80 years aged 90+ years aged 90+ years
(n=239,670) (n=13,071,730) (n=184,060) (n=990, 390)
Mean age (years) 74 72 ≥90 ≥90
Sex (%)
Female 54 53 67 60
Male 43 45 30 38
Unknown 2 2 3 2
Race (%)
White 68 66 69 62
Black or African American 15 11 9 7
Asian 3 3 6 3
Other, mixed, unknown 14 20 16 28
Ethnicity (%)
Non-Hispanic 74 65 74 63
Hispanic 6 4 4 3
Unknown 21 31 21 34
Note: Demographic data were generated from the TriNetX database using the abovementioned search terms. The database search included data on
more than 150 individuals in the United States who visited a health care provider in 2021 – 2023.
Abbreviations: ADRD: Alzheimer’s disease and related dementias; ICD-10: International classification of diseases, tenth revision.
cohort without an ADRD diagnosis had a mean age of in Table 3 (column A), the 65 – 80-year-old individuals
72 years. The mean age of the ≥90-year-old cohorts could with ADRD had risk ratios of ≥2.0 in 6/22 chapters and
not be calculated because specific age values >89 years ≥1.5 in 16/22 chapters than the 65 – 80-year-old individuals
are not provided in the TriNetX database to increase the without ADRD. Similarly, the ≥90-year-old individuals
anonymity of these patients. with ADRD had risk ratios of ≥2.0 in 15/22 chapters and
Data on sex, race, and ethnicity are provided in ≥1.5 in 17/22 chapters than the ≥90-year-old individuals
Table 1; these data were generally consistent with previous without ADRD (Table 3, column B).
epidemiological data for ADRD. Furthermore, the pattern of risk ratios of individuals
3.2. ICD-10 chapter code analysis of cohorts with and without ADRD in both the 65 – 80-year-old and
≥90-year-old cohorts was almost identical, as shown by
Table 2 shows the prevalence of signs, symptoms, and scatterplots in Figure 1A and B.
disorders within each of the 22 major ICD-10 code
chapters for each of the four study cohorts. To facilitate The Pearson correlation coefficients for the data in
the comparisons of the chapter data, each decile of the Figure 1A were 0.88 (p < 0.00001) between 65 and 80-year-
prevalence data was coded by a different color and/or text old individuals with and without ADRD and 0.86 (p <
bolding, as described in the table legend. 0.00001) between ≥90-year-old individuals with and
without ADRD.
Prevalence rates in the ADRD cohorts were higher than
those in the non-ADRD cohorts in 21 of the 22 ICD-10 Risk ratio comparisons were also performed between
chapters (there was a 0% prevalence of perinatal disorders the younger and older cohorts with ADRD and without
in all four cohorts). ADRD. As illustrated in Table 3 (column C), the
≥90-year-old ADRD cohort had risk ratios of ≥1.5 in 0/22
3.3. Risk ratios based on the prevalence of signs, chapters compared with those of the 65 – 80-year-old ADRD
symptoms, and disorders in the 22 ICD-10 chapters cohort. Similarly, as presented in Table 3 (column D), the
Risk ratios were calculated using the prevalence data, as ≥90-year-old non-ADRD cohort had risk ratios of ≥1.5 in
shown in Table 2, for each cohort comparison. As presented 0/22 chapters compared with those of the 65 – 80-year-old
Volume 4 Issue 3 (2025) 102 doi: 10.36922/an.4046