
Page 51 - ARNM-2-2
P. 51
Advances in Radiotherapy
& Nuclear Medicine PET and Compton Camera CZT based system
A B C
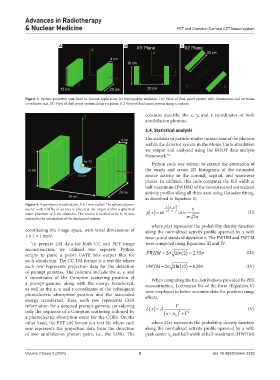
Figure 3. System geometry visualized in Geant4 application for tomography emission. (A) View of dual panel system with dimensions and cartesian
coordinate axis. (B) View of dual panel system along y-z plane. (C) View of dual panel system along x-z plane.
columns describe the x, y, and z coordinates of both
annihilation photons.
2.4. Statistical analysis
The statistics of particle-matter interactions of the photons
within the detector system in the Monte Carlo simulation
are output and analyzed using the ROOT data analysis
framework. 55
Python code was written to extract the estimation of
the voxels and create 2D histograms of the estimated
source activity in the coronal, sagittal, and transverse
planes. In addition, this code computes the full width at
half-maximum (FWHM) of the reconstructed normalized
activity profiles along all three axes using Gaussian fitting,
as described in Equation II,
Figure 4. Experiment visualization. A 0.1 mm radius As spherical point 2
72
1
x
source with 2 MBq of activity is placed at the origin within a spherical 1
2
water phantom of 2 cm diameter. The source is located at (0, 0, 0) mm px ae ; a (II)
central to the orientation of the dual panel system. 2
where p(x) represents the probability density function
constituting the image space, with voxel dimensions of along the normalized activity profile spanned by x with
1 × 1 × 1 mm . mean μ and standard deviation σ. The FWHM and FWTM
3
To prepare LM data for both CC and PET image were computed using Equations III and IV.
reconstruction, we utilized two separate Python
scripts to parse a priori GATE hits output files for FWHM 2 2 ln 2 2 35. (III)
each simulation. The CC LM format is a text file where
each row represents projection data for the detection FWTM 2 2ln 10 429. (IV)
of prompt gammas. The columns include the x, y, and
z coordinates of the Compton scattering position of When computing fits for distributions provided by PET
a prompt-gamma, along with the energy transferred, reconstruction, Lorentzian fits of the form (Equation V)
as well as the x, y, and z coordinates of the subsequent were employed to better accommodate the positron range
photoelectric absorption position and the associated effects,
energy transferred. Thus, each row represents COR
information for a detected prompt-gamma, considering Lx A (V)
only the sequence of a Compton scattering followed by xx 2
2
a photoelectric absorption event for the CORs. On the 0
other hand, the PET LM format is a text file where each where L(x) represents the probability density function
row represents the projection data from the detection along the normalized activity profile spanned by x with
of two annihilation photon pairs, i.e., the LORs. The peak center x and half-width at half-maximum (HWHM)
0
Volume 2 Issue 2 (2024) 5 doi: 10.36922/arnm.3330