
Page 52 - ARNM-2-2
P. 52
Advances in Radiotherapy
& Nuclear Medicine PET and Compton Camera CZT based system
Γ. The FWHM is therefore equal to 2Γ while the FWTM is around 511 keV. This would explain the distribution of
computed as 2Γ 9. photoelectric absorption below the Compton shelf of the
511 keV photons at 340 keV, where the cross-section of
3. Results photoelectric absorption is significantly higher for CZT.
3.1. Sensitivity 3.2. Image reconstruction and comparison
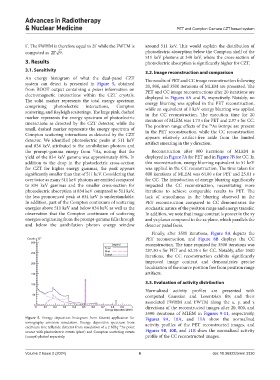
An energy histogram of what the dual-panel CZT The results of PET and CC image reconstruction following
system can detect is presented in Figure 5, obtained 20, 800, and 3500 iterations of MLEM are presented. The
from ROOT output containing a priori information on PET and CC image reconstructions after 20 iterations are
electromagnetic interactions within the CZT crystals. displayed in Figures 6A and B, respectively. Notably, no
The solid marker represents the total energy spectrum energy blurring was applied in the PET reconstruction,
comprising photoelectric interactions, Compton while an equivalent of 1 keV energy blurring was applied
scattering, and Rayleigh scatterings. The large pink, dashed in the CC reconstruction. The execution time for 20
marker represents the energy spectrum of photoelectric iterations of MLEM was 1.73 s for PET and 2.97 s for CC.
interactions as detected by the CZT detector, while the The positron range effects of the As isotope are present
72
small, dashed marker represents the energy spectrum of in the PET reconstruction, while the CC reconstruction
Compton scattering interactions as detected by the CZT appears relatively artifact-free aside from the limited
detector. We identified photoelectric peaks at 511 keV artifact smearing in the y direction.
and 834 keV, attributed to the annihilation photons and
the prompt-gamma energy from As, noting that the Reconstruction after 800 iterations of MLEM is
72
yield of the 834 keV gamma was approximately 81%. In displayed in Figure 7A for PET and in Figure 7B for CC. In
addition to the drop in the photoelectric cross-section this reconstruction, energy blurring equivalent to 51 keV
for CZT for higher energy gammas, the peak appears was applied in the CC reconstruction. The time taken for
significantly smaller than that of 511 keV. Considering that 800 iterations of MLEM was 64.00 s for PET and 25.81 s
over twice as many 511 keV photons are emitted compared for CC. The introduction of energy blurring significantly
to 834 keV gammas and the smaller cross-section for impacted the CC reconstruction, necessitating more
photoelectric absorption at 834 keV compared to 511 keV, iterations to achieve comparable results to PET. The
the less pronounced peak at 834 keV is understandable. lack of smoothness in the blurring observed in the
In addition, part of the Compton continuum of scattering PET reconstruction compared to CC demonstrates the
energies above 511 keV and below 834 keV, as well as the stochastic nature of the positron range and energy transfer.
observation that the Compton continuum of scattering In addition, we note that image contrast is poorer in the xy
energies originating from the prompt-gamma falls through and yz planes compared to the xz plane, which parallels the
and below the annihilation photon energy window detector panel faces.
Finally, after 3500 iterations, Figure 8A depicts the
PET reconstruction, and Figure 8B displays the CC
reconstruction. The time required for 3500 iterations was
287.30 s for PET and 62.76 s for CC. Notably, after 3500
iterations, the CC reconstruction exhibits significantly
improved image contrast and demonstrates precise
localization of the source position free from positron range
artifacts.
3.3. Evaluation of activity distribution
Normalized activity profiles are presented with
computed Gaussian and Lorentzian fits and their
associated FWHM and FWTM along the x, y, and z
directions of the reconstructed images after 20, 800, and
3500 iterations of MLEM in Figures 9-11, respectively.
Figure 5. Energy deposition histogram from Geant4 application for Figures 9A, 10A, and 11A show the normalized
tomography emission simulation. Energy deposition spectrum from activity profiles of the PET reconstructed images, and
cadmium zinc telluride detector from simulation of a 2 MBq As point
72
source with photoelectric events (phot) and Compton scattering events Figures 9B, 10B, and 11B show the normalized activity
(compt) plotted separately. profile of the CC reconstructed images.
Volume 2 Issue 2 (2024) 6 doi: 10.36922/arnm.3330