
Page 84 - ARNM-2-4
P. 84
Advances in Radiotherapy
& Nuclear Medicine Dose-volume histogram and gamma analysis
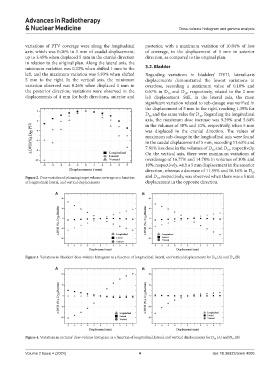
variations of PTV coverage were along the longitudinal posterior, with a maximum variation of 10.04% of loss
axis, which was 0.06% in 1 mm of caudal displacement, of coverage, in the displacement of 5 mm in anterior
up to 3.45% when displaced 5 mm in the cranial direction direction, as compared to the original plan.
in relation to the original plan. Along the lateral axis, the
minimum variation was 0.22% when shifted 1 mm to the 3.2. Bladder
left, and the maximum variation was 5.93% when shifted Regarding variations in bladders’ DVH, lateral-axis
5 mm to the right. In the vertical axis, the minimum displacements demonstrated the lowest variations in
variation observed was 0.26% when displaced 1 mm in overdose, recording a maximum value of 0.10% and
the posterior direction; variations were observed in the 0.07% in D and D , respectively, related to the 2 mm
10
30
displacements of 4 mm for both directions, anterior and left displacement. Still, in the lateral axis, the most
significant variation related to sub-dosage was verified in
the displacement of 5 mm to the right, reaching 1.39% for
D and the same value for D . Regarding the longitudinal
10
30
axis, the maximum dose increase was 9.29% and 5.64%
in the volumes of 30% and 10%, respectively, when 5 mm
was displaced in the cranial direction. The values of
maximum sub-dosage in the longitudinal axis were found
in the caudal displacement of 5 mm, recording 11.63% and
7.81% less dose in the volumes of D and D , respectively.
30
10
On the vertical axis, there were maximum variations of
overdosage of 16.77% and 14.70% in volumes of 30% and
10%, respectively, with a 5 mm displacement in the anterior
direction, whereas a decrease of 11.59% and 16.16% in D
30
Figure 2. Dose variation of planning target volume coverage as a function and D , respectively, was observed when there was a 5 mm
10
of longitudinal, lateral, and vertical displacements displacement in the opposite direction.
A B
Figure 3. Variations in bladders’ dose-volume histogram as a function of longitudinal, lateral, and vertical displacements for D 30 (A) and D 10 (B)
A B
Figure 4. Variations in rectums’ dose-volume histogram as a function of longitudinal, lateral, and vertical displacements for D 30 (A) and D 10 (B)
Volume 2 Issue 4 (2024) 4 doi: 10.36922/arnm.4005