
Page 85 - ARNM-2-4
P. 85
Advances in Radiotherapy
& Nuclear Medicine Dose-volume histogram and gamma analysis
3.3. Rectum were related to the displacements along the vertical axis.
The comparisons of the rectums’ DVH revealed that the Such variations presented both overdose and significant
displacements in the longitudinal axis demonstrated the dose decreases in critical structures. From the comparison
greatest stability, registering values of an overdose of only between Table 1 and the data presented in Figures 2-4, as
0.01%, both for D and D when displaced 1 mm in the a function of the displacements in the vertical axis in the
30
10
caudal direction, as well as maximum sub-dosage of 0.07% DVH of organs at risk, the same correlation between the
and 0.05% for D and D , respectively, when displaced 3 mm 3DGI and the DVH metric was verified, and the behavior
10
30
in the same direction. Regarding the lateral axis, however, was presented in a linear way, serving as the standard
the rectums’ DVH showed an increase of up to 5.18% and established between the volume of treatment and the index
0.71% of dose tolerance for D and D , respectively, when of points validated through 3DGI analysis. This trend
30
10
there was a 5 mm displacement to the right. Still, on the is shown in Figure 6. Similarly, such behavior was also
lateral axis, the maximum sub-dosage of 1.36% for D was
30
observed in the event of 3 mm displacement to the left, and
an overdose of 0.02% for D was observed for the same
10
displacement. More significant variations were observed in
the vertical axis, reaching an overdose of up to 20.45% and
3.10% for D and D , respectively, when displaced 5 mm
10
30
in the posterior direction, whereas for a 5 mm displacement
in the opposite direction, a dose decrease of 20.39% and
16.09% for D and D , respectively, was noted.
30
10
4. Discussion
The present study showed that the minimum relative
dose variation found for the PTV was 0.06%, reaching up Figure 5. Relationship between the approval percentage of the three-
to 10.04% loss of coverage. Regarding critical structures, dimensional gamma index and the planning target volume coverage
the percentage differences of overdose found were up to variation on the longitudinal, lateral, and vertical displacements
16.77% in the bladder volume and 20.45% in the rectum.
For organs at risk, there were variations related to sub- A
dosage, reaching a minimum dose of 16.16% in the bladder
and 20.39% in the rectum.
Through the comparison of the data obtained from
the analysis of 3DGI, shown in Table 1, with the data
related to the loss of coverage verified in the DVH along
the lateral, longitudinal, and vertical axes, we were able to
establish the correlation between the 3DGI tool and the
DVH metric, where the behavior was presented in a linear
fashion, presenting a degree of agreement of 0.96% in the
lateral axis, 0.85% in the longitudinal axis, and 0.94% in the B
vertical axis. These values were considered acceptable and
are shown in Figure 5.
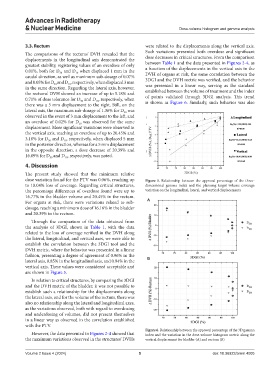
In relation to critical structures, by comparing the 3DGI
and the DVH metric of the bladder, it was not possible to
establish such a relationship for the displacements along
the lateral axis, and for the volume of the rectum, there was
also no relationship along the lateral and longitudinal axes,
as the variations observed, both with regard to overdosing
and underdosing of volumes, did not present themselves
in a linear way as observed in the correlation established
with the PTV.
Figure 6. Relationship between the approval percentage of the 3D gamma
However, the data presented in Figures 2-4 showed that index and the variation in the dose-volume histogram metric along the
the maximum variations observed in the structures’ DVHs vertical displacement for bladder (A) and rectum (B)
Volume 2 Issue 4 (2024) 5 doi: 10.36922/arnm.4005