
Page 90 - ARNM-2-4
P. 90
Advances in Radiotherapy
& Nuclear Medicine Dose prescription and reporting in SRS
clinical intent. Statistical analysis of the collected dosimetric The distribution of various dose-volume characteristics
data was performed to identify variability and correlations is shown in Figure 3. Hotspot values, which are defined as
among treatment outcomes. Descriptive statistics were the maximum dose received by a specified volume, were
utilized to summarize the findings, with appropriate tests significantly lower (P < 0.05) in treatment plans for the
employed to evaluate differences and similarities. brain and prostate compared to other disease sites.
3. Results According to ICRU-83 recommendations, it is advised
9
A total of 300 VMAT SBRT/SRS plans were analyzed to maintain the HI as low as possible for 3DCRT and IMRT
following the application of exclusion criteria. The study plans. However, for SBRT plans, higher HI values may be
10
included radiotherapy patients treated by nine radiation acceptable due to the steep dose gradients. In our study,
oncologists, with treatment plans developed by four the mean HI was 0.20 (standard deviation: 0.05), indicating
RMPs. The distribution of disease sites among the patient a reasonable level of homogeneity in the treatment plans.
cohort was as follows: lung (34.0%), brain (20.7%),
prostate (19.6%), bones (13.0%), pelvic soft tissue (7.7%),
and liver (5.0%). The treatments were delivered in 3, 5, or
6 fractions, with the dose per fraction varying between 5
and 13 Gy.
The variability in PTV volumes by disease site is
illustrated in Figure 1. The smallest median PTV volume
was observed in brain cases (9.4 cc), whereas the largest
median volume was noted in prostate cases (107.2 cc). This
significant difference highlights the variations in treatment
planning and delivery across different tumor types.
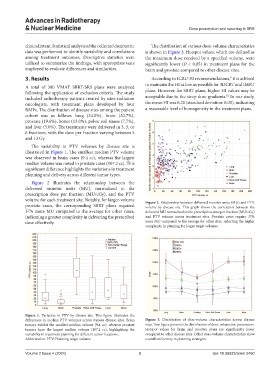
Figure 2 illustrates the relationship between the
delivered monitor units (MU), normalized to the
prescription dose per fraction (MU/cGy), and the PTV
volume for each treatment site. Notably, for larger-volume Figure 2. Relationship between delivered monitor units (MU) and PTV
prostate cases, the corresponding SBRT plans required volume by disease site. This graph shows the correlation between the
37% more MU compared to the average for other cases, delivered MU normalized to the prescription dose per fraction (MU/cGy)
indicating a greater complexity in delivering the prescribed and PTV volume across treatment sites. Prostate cases require 37%
dose effectively. more MU compared to the average for other sites, reflecting the higher
complexity in planning for larger target volumes.
Figure 1. Variation in PTV by disease site. This figure illustrates the
differences in median PTV volumes across various disease sites. Brain Figure 3. Distribution of dose-volume characteristics across disease
tumors exhibit the smallest median volume (9.4 cc), whereas prostate sites. This figure presents the distribution of dose-volumetric parameters.
tumors have the largest median volume (107.2 cc), highlighting the Hotspot values for brain and prostate plans are significantly lower
variability in treatment planning for different tumor locations. compared to other disease sites. Other dose-volume characteristics show
Abbreviation: PTV: Planning target volume. overall uniformity in planning strategies.
Volume 2 Issue 4 (2024) 3 doi: 10.36922/arnm.5450