
Page 81 - ARNM-3-1
P. 81
Advances in Radiotherapy
& Nuclear Medicine Cone beam-focused GK dosimetric analysis
(O,Y,Z) and OAR (X,O,Z) are the ratios of doses at an off-
axis point (0, Y, Z) and (X,0, Z) to the dose on the central
Z 2
beam axis at the same depth in a phantom; f + + Z m
f
is a factor related to rotating focusing in space.
TMR is the ratio of the dose rate at a given point in
phantom D to the dose rate at the same source-point
d
distance and the reference depth of maximum dose D .
m
As shown in Figure 3, the defining equation of TMR is
represented by the following equation:
D
TMR Z d (III)
( ) =
D m
Where TMR is the ratio of the dose rate at a given point
in phantom D to the dose rate at the same source-point Figure 2. Coordinate system of gamma beam stereotactic radiotherapy
d
distance and the reference depth of maximum dose D . system
m
OAR is the ratio of the dose at an off-axis point to
the dose on the central beam axis at the same depth in a
phantom. It is a representation of dose distribution based
on an isodose curve.
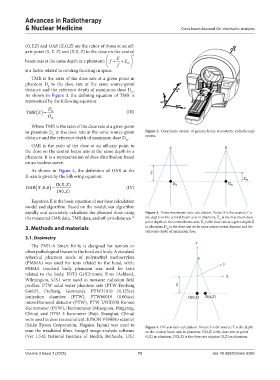
As shown in Figure 4, the definition of OAR at the
X-axis is given by the following equation:
D ( ,)XZ
OAR ( X̹ 0 0̹ ) = (IV)
D (0, )Z
Equation II is the basic equation of our dose calculation
model and algorithm. Based on the model, our algorithm
rapidly and accurately calculates the planned dose using Figure 3. Tissue maximum ratio calculation. Notes: S is the source; Z is
the measured OAR data, TMR data, and off-axis distance. 12 the depth on the central beam axis in phantom; Z is the maximum dose
m
point depth on the central beam axis; D is the dose rate at a given depth Z
d
3. Methods and materials in phantom; D is the dose rate at the same source-point distance and the
m
reference depth of maximum dose.
3.1. Dosimetry
The ZND-A Smart Knife is designed for tumors or
other pathological tissues in the head and body. A standard
spherical phantom made of polymethyl methacrylate
(PMMA) was used for tests related to the head, while
PMMA standard body phantom was used for tests
related to the body. EBT3 GafChromic films (Ashland,
Wilmington, U.S.) were used to measure radiation field
profiles. PTW solid water phantom sets (PTW‐Freiburg
GmbH, Freiburg, Germany), PTW31010 (0.125cc)
ionization chamber (PTW), PTW60019 (0.004cc)
microDiamond detector (PTW), PTW UNIDOS Romeo
electrometer (PTW), thermometer (Miaoguan, Pingyang,
China) and DYM 3 barometer (Boji, Shanghai, China)
were used in dose measurement. EPSON V850Pro scanner
(Seiko Epson Corporation, Nagano, Japan) was used to Figure 4. Off-axis ratio calculation. Notes: S is the source; Z is the depth
scan the irradiated films. ImageJ image analysis software on the central beam axis in phantom; D(0,Z) is the dose rate at point
(Ver 1.54f; National Institute of Health, Bethesda, U.S.) (0,Z) in phantom; D(X,Z) is the dose rate at point (X,Z) in phantom.
Volume 3 Issue 1 (2025) 73 doi: 10.36922/arnm.6280