
Page 84 - ARNM-3-1
P. 84
Advances in Radiotherapy
& Nuclear Medicine Cone beam-focused GK dosimetric analysis
A B
C D
Figure 6. Grayscale-dose calibration curve
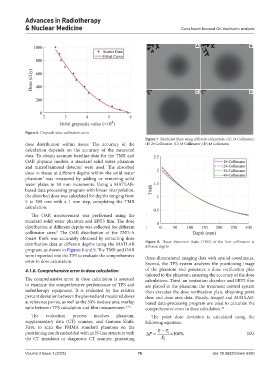
Figure 7. Irradiated films using different collimators. (A) 1# Collimator;
dose distribution within tissue. The accuracy of the (B) 2# Collimator; (C) 3# Collimator; (D) 4# Collimator.
calculation depends on the accuracy of the measured
data. To obtain accurate baseline data for the TMR and
OAR physical models, a standard solid water phantom
and microDaimond detector were used. The absorbed
dose in tissue at different depths within the solid water
phantom was measured by adding or removing solid
7
water plates in 30 mm increments. Using a MATLAB-
based data processing program with linear interpolation,
the absorbed dose was calculated for depths ranging from
5 to 300 mm with a 1 mm step, completing the TMR
calculation.
The OAR measurement was performed using the
standard solid water phantom and EBT3 film. The dose
distribution at different depths was collected for different
collimator sizes. The OAR distribution of the ZND-A
8
Smart Knife was accurately obtained by extracting dose
distribution data at different depths using the MATLAB Figure 8. Tissue Maximum Ratio (TMR) of the four collimators at
different depths
program, as shown in Figures 8 and 9. The TMR and OAR
were imported into the TPS to evaluate the comprehensive three-dimensional imaging data with spatial coordinates.
error in dose calculation. Second, the TPS system analyzes the positioning image
4.1.6. Comprehensive error in dose calculation of the phantom and generates a dose verification plan
tailored to the phantom, ensuring the accuracy of the dose
The comprehensive error in dose calculation is assessed calculations. Third, an ionization chamber and EBT3 film
to examine the comprehensive performance of TPS and are placed in the phantom; the treatment control system
radiotherapy equipment. It is evaluated by the relative then executes the dose verification plan, obtaining point
percent deviation between the planned and measured doses dose and dose area data. Finally, ImageJ and MATLAB-
at reference points, as well as the 50% isodose area overlap based data-processing program are used to calculate the
ratio between TPS calculation and film measurement. 9,10 comprehensive error in dose calculation. 13
The evaluation process involves phantom, The point dose deviation is calculated using the
supplementary data (CT) scanner, and Gamma Knife. following equation:
First, to scan the PMMA standard phantom on the
positioning couch embedded with an N-line structure with ∆ =P P 1 − P 0 × 100% (IX)
the CT simulator or diagnostic CT scanner, generating P 0
Volume 3 Issue 1 (2025) 76 doi: 10.36922/arnm.6280