
Page 85 - ARNM-3-1
P. 85
Advances in Radiotherapy
& Nuclear Medicine Cone beam-focused GK dosimetric analysis
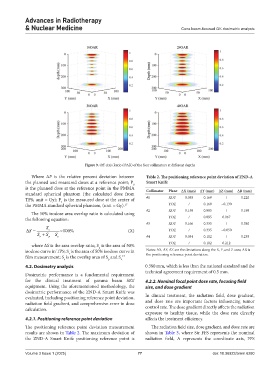
Figure 9. Off-Axis Ratio (OAR) of the four collimators at different depths
Where ∆P is the relative percent deviation between Table 2. The positioning reference point deviation of ZND‑A
the planned and measured doses at a reference point; P Smart Knife
0
is the planned dose at the reference point in the PMMA Collimator Plane ΔX (mm) ΔY (mm) ΔZ (mm) ΔR (mm)
standard spherical phantom (the calculated dose from
TPS; unit = Gy); P is the measured dose at the center of #1 XOY 0.038 0.169 / 0.220
1
the PMMA standard spherical phantom, (unit = Gy). 17 YOZ / 0.169 −0.130
#2 XOY 0.159 0.095 / 0.198
The 50% isodose area overlap ratio is calculated using
the following equation: YOZ / 0.095 0.067
#3 XOY 0.166 0.335 / 0.380
S
∆=S c × 100% (X) YOZ / 0.335 −0.050
r + S p − S S c #4 XOY 0.034 0.102 / 0.238
where ∆S is the area overlap ratio; S is the area of 50% YOZ / 0.102 0.212
p
isodose curve in TPS; S is the area of 50% isodose curve in Notes: ΔX, ΔY, ΔZ are the deviations along the X, Y, and Z axes; ∆R is
r
film measurement; S is the overlap area of S and S r. 17 the positioning reference point deviation.
c
p
4.2. Dosimetry analysis 0.380 mm, which is less than the national standard and the
technical agreement requirement of 0.5 mm.
Dosimetric performance is a fundamental requirement
for the clinical treatment of gamma beam SRT 4.2.2. Nominal focal point dose rate, focusing field
equipment. Using the aforementioned methodology, the size, and dose gradient
dosimetric performance of the ZND-A Smart Knife was
evaluated, including positioning reference point deviation, In clinical treatment, the radiation field, dose gradient,
radiation field gradient, and comprehensive error in dose and dose rate are important factors influencing tumor
calculation. control rate. The dose gradient directly affects the radiation
exposure to healthy tissue, while the dose rate directly
4.2.1. Positioning reference point deviation affects the treatment efficiency.
The positioning reference point deviation measurement The radiation field size, dose gradient, and dose rate are
results are shown in Table 2. The maximum deviation of shown in Table 3, where Str FFS represents the nominal
the ZND-A Smart Knife positioning reference point is radiation field, A represents the coordinate axis, FFS
Volume 3 Issue 1 (2025) 77 doi: 10.36922/arnm.6280