
Page 74 - BH-2-4
P. 74
Brain & Heart Automatic cardiac autonomic modulation assessment
2.2. HRV recordings and analysis the reliability of PNSi, SNSi, and BSTRi measurements
We conducted 24-h 12-lead Holter ECG recordings from these shorter intervals.
using the H12 (Mortara Instruments). Real-time ECG For the training sessions, HRV parameters were
monitoring during tactical and physical training was calculated using 2-min intervals taken at baseline rest,
carried out with a 3-lead wearable ECG (Nuubo, Spain). every 4 min during exertion, and at the first, fifth, and
For longitudinal monitoring during physical training, tenth min of recovery. ECG data from 40 training sessions
each session included 10 min of baseline rest, 5 min of (10 sessions for each workload) were analyzed. The PNSi,
warm-up, 30 min of exercise, and 10 min of recovery. SNSi, and BSTRi values resulting from each workload were
The training workload was categorized by age into low averaged and compared to evaluate reproducibility across
(65–75 watts/min), moderate (75–85 watts/min), semi- sessions with the same workload.
intense (85–95 watts/min), and intense (95–110 watts/ Kubios calculates the PNSi by integrating three
min). For this study, ECG data from 40 training sessions parameters: the mean RR interval, the RMSSD (the
(10 sessions for each workload) were analyzed. mean square root of successive RR interval differences,
HRV parameters were calculated using Kubios Premium closely related to parasympathetic cardiac activation),
software (version 3.5.0) in TD, FD, and NL methods, along and the SD1 index from Poincaré plot (in normalized
with time-varying algorithms, following “detrending” units), which correlates with the RMSSD. The PNS
40
with the “smooth priors” function (lambda = 500). index is considered normal during rest if it falls within
±2 standard deviations (SD) of the normal population
Short-term HRV was calculated over 5 min during distribution. 40
4
regular daily activities and NREM sleep for all participants,
as well as during highly stressful police tactical training The SNSi is computed using three parameters: the
(16 cases). In addition, HRV parameters were assessed mean HR interval, the BSTRi, and the SD2 index from the
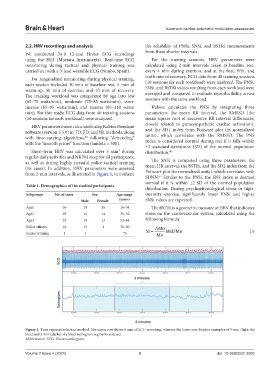
from 2-min intervals, as illustrated in Figure 1, to evaluate Poincaré plot (in normalized units), which correlates with
SDNN. Similar to the PNSi, the SNS index is deemed
42
normal if it is within ±2 SD of the normal population
Table 1. Demographics of the studied participants
distribution. During psychophysiological stress or high-
Subgroups No. of cases Sex Age range intensity exercise, significantly lower PNSi and higher
Male Female (years) SNSi values are expected.
Age1 36 10 26 16–34 The BSTRi is a geometric measure of HRV that indicates
Age2 29 15 14 35–52 stress on the cardiovascular system, calculated using the
Age3 23 10 13 53–84 following formula:
Police officers 16 15 1 31–50 AMo
Senior training 1 1 75 SI = Mo MxDMn (I)
Figure 1. Time segment selection method. The upper row shows 6 min of ECG recording, whereas the lower row displays examples of 5-min (light sky
blue) and 2-min (darker sky blue) tachogram segments selected
Abbreviation: ECG: Electrocardiogram.
Volume 2 Issue 4 (2024) 3 doi: 10.36922/bh.3503