
Page 77 - BH-2-4
P. 77
Brain & Heart Automatic cardiac autonomic modulation assessment
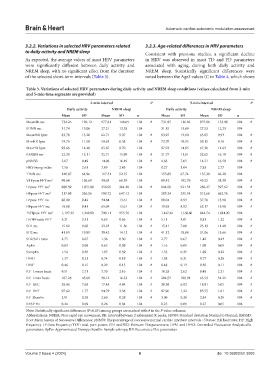
3.2.2. Variations in selected HRV parameters related 3.2.3. Age-related differences in HRV parameters
to daily activity and NREM sleep Consistent with previous studies, a significant decline
As expected, the average values of most HRV parameters in HRV was observed in most TD and FD parameters
were significantly different between daily activity and associated with aging, during both daily activity and
NREM sleep, with no significant effect from the duration NREM sleep. Statistically significant differences were
of the selected short-term intervals (Table 3). noted between the Age3 values (C in Table 4, which shows
Table 3. Variations of selected HRV parameters during daily activity and NREM sleep conditions (values calculated from 2‑min
and 5‑min time segments are provided)
2‑min interval P 5‑min interval P
Daily activity NREM sleep Daily activity NREM sleep
Mean SD Mean SD n Mean SD Mean SD n
MeanRR ms 734.26 120.12 977.81 148.69 104 # 731.95 116.82 975.00 153.99 104 #
SDNN ms 31.74 15.06 27.21 12.53 104 31.15 13.69 27.53 12.23 104
MeanHR bpm 83.78 13.20 62.71 9.07 104 # 83.97 13.00 63.05 9.93 104 #
MinHR bpm 74.73 11.50 59.63 8.58 104 # 72.70 10.95 59.15 9.18 104 #
MaxHR bpm 93.66 14.48 65.65 9.70 104 97.02 14.85 67.36 11.63 104 #
RMSSD ms 22.30 12.11 32.71 15.99 104 # 21.77 11.01 32.65 16.10 104 #
pNN50 5.07 8.49 14.08 16.49 104 # 4.63 7.65 14.21 16.50 104 #
HRVtriang index 7.56 2.61 7.09 2.43 104 8.27 3.04 7.83 2.77 104
TINN ms 140.87 64.96 117.31 52.15 104 155.89 67.74 135.38 62.20 104
VLFpow FFT ms 2 98.64 130.69 39.03 60.39 104 99.42 102.79 45.55 58.30 104 #
LFpow FFT ms 2 880.39 1,051.88 250.05 364.28 104 # 844.50 921.31 286.27 397.62 104 #
HFpow FFT ms 2 217.98 336.56 508.72 647.12 104 203.24 235.34 512.60 662.76 104 #
LFpow FFT nu 80.09 9.42 34.84 13.61 104 # 80.04 8.93 37.78 13.98 104 #
HFpow FFT nu 19.88 9.41 65.09 13.61 104 # 19.93 8.92 62.17 13.98 104 #
TOTpow FFT ms 2 1,197.25 1,342.90 798.11 955.76 104 1,147.42 1,168.60 844.74 1,014.20 104
LF/HF ratio FFT 5.21 3.31 0.65 0.66 104 # 5.11 3.01 0.81 1.22 104 #
SD1 ms 15.82 8.60 23.23 11.36 104 # 15.41 7.80 23.13 11.40 104 #
SD2 ms 41.85 19.89 30.42 14.12 104 # 41.12 18.08 31.06 13.66 104 #
SD2/SD1 ratio 2.75 0.67 1.36 0.30 104 # 2.77 0.67 1.42 0.43 104 #
ApEn 0.83 0.09 0.65 0.09 104 # 1.16 0.09 1.08 0.09 104 #
SampEn 1.54 0.30 1.95 0.39 104 # 1.53 0.25 1.89 0.22 104 #
DFA1 1.37 0.21 0.74 0.19 104 # 1.38 0.21 0.77 0.20 104 #
DFA 2 0.46 0.15 0.29 0.13 104 # 0.48 0.13 0.30 0.11 104 #
RP_Lmean beats 9.51 2.71 7.70 2.16 104 # 10.28 2.62 8.48 2.21 104 #
RP_Lmax beats 107.28 45.60 38.12 16.23 104 # 204.55 108.91 63.53 31.21 104 #
RP_REC 29.06 7.63 17.48 4.94 104 # 30.59 6.92 18.91 5.05 104 #
RP_DET 97.62 1.77 94.79 2.38 104 # 97.96 1.32 95.55 1.81 104 #
RP_ShanEn 2.91 0.29 2.60 0.29 104 # 3.09 0.28 2.84 0.29 104 #
RESP Hz 0.24 0.09 0.26 0.04 104 0.25 0.09 0.27 0.05 104
Note: Statistically significant differences (P<0.05) among groups are marked with # in the P-value columns.
Abbreviations: NREM: Non-rapid eye movement; RR: Interval between 2 subsequent R peaks; SDNN: Standard deviation Normal to Normal; RMSSD:
Root Mean Square of Successive Differences; pNN50: The percentage of successive normal cardiac interbeat intervals >50 msec HR heart rate; HF: High
frequency. LF: Low frequency; TOT: total. pwr: power; SD1 and SD2: Poincare Plot parameters; DFA1 and DFA2: Detrended Fluctuation Analysis alfa
parameters; ApEn: Approximated Entropy; SamEn: Sample entropy; RP: Recurrence Plot parameters.
Volume 2 Issue 4 (2024) 6 doi: 10.36922/bh.3503