
Page 78 - BH-2-4
P. 78
Brain & Heart Automatic cardiac autonomic modulation assessment
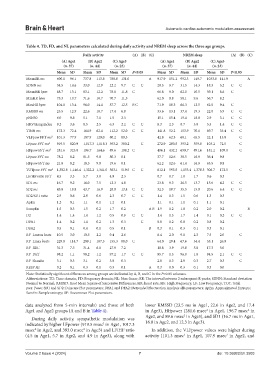
Table 4. TD, FD, and NL parameters calculated during daily activity and NREM sleep across the three age groups.
Daily activity (A) (B) (C) NREM sleep (A) (B) (C)
(A) Age1 (B) Age2 (C) Age3 (A) Age1 (B) Age2 (C) Age3
(n. 37) (n. 44) (n. 23) (n. 37) (n. 44) (n. 23)
Mean SD Mean SD Mean SD P<0.05 Mean SD Mean SD Mean SD P<0.05
MeanRR ms 690.1 96.1 737.8 113.8 788.0 131.0 A 917.9 151.2 992.3 149.7 1033.8 141.9 A
SDNN ms 34.5 14.6 33.0 12.9 22.2 9.7 C C 28.5 9.7 31.5 14.3 18.3 5.2 C C
MeanHR bpm 88.7 13.1 83.1 12.2 78.0 11.8 C 66.8 9.0 62.0 10.5 59.1 8.6 C
MinHR bpm 75.3 10.7 71.6 10.7 70.7 11.5 62.0 8.8 58.1 9.6 56.7 8.2
MaxHR bpm 104.0 13.4 96.0 14.4 87.7 12.5 B C 71.9 10.3 66.3 12.5 62.0 9.4 C
RMSSD ms 23.5 12.9 22.6 10.7 17.4 6.8 33.6 13.1 37.4 19.3 22.0 5.9 C C
pNN50 6.0 9.8 5.1 7.1 1.5 2.3 15.1 15.4 19.4 18.8 2.9 3.1 C C
HRVtriang index 9.2 3.6 8.5 2.5 6.3 2.2 C C 8.3 2.3 8.7 3.0 5.5 1.4 C C
TINN ms 172.3 72.4 164.9 62.4 112.2 52.0 C C 141.8 52.2 153.9 70.1 89.7 33.4 C C
VLFpow FFT ms 2 101.3 77.9 107.9 129.0 80.2 80.3 42.8 62.3 60.1 65.5 22.1 13.0 C
LFpow FFT ms 2 919.5 820.9 1,017.3 1,118.3 393.2 380.2 C 272.9 200.8 393.2 559.0 103.2 72.5 C
HFpow FFT ms 2 281.6 323.0 196.7 164.6 89.6 108.2 C 496.1 432.2 699.7 891.6 181.2 109.0 C
LFpow FFT nu 78.2 8.2 81.5 9.8 80.3 8.1 37.7 12.6 38.5 16.9 36.4 9.8
HFpow FFT nu 21.8 8.2 18.5 9.8 19.6 8.1 62.2 12.6 61.4 16.9 63.5 9.8
TOTpow FFT ms 2 1,302.8 1,146.4 1,322.2 1,341.0 563.1 519.5 C C 812.1 593.8 1,153.4 1,378.5 306.7 172.5 C
LF/HF ratio FFT 4.5 3.3 5.7 3.0 4.9 2.3 0.7 0.7 1.0 1.7 0.6 0.3
SD1 ms 16.7 9.2 16.0 7.5 12.3 4.8 23.8 9.3 26.5 13.7 15.6 4.2 C C
SD2 ms 45.8 18.8 43.7 16.9 28.8 13.4 C C 32.3 10.7 35.5 15.8 20.6 6.4 C C
SD2/SD1 ratio 2.9 0.6 2.9 0.6 2.3 0.7 C C 1.4 0.3 1.5 0.6 1.3 0.3
ApEn 1.2 0.1 1.1 0.1 1.2 0.1 1.1 0.1 1.1 0.1 1.1 0.1
SampEn 1.5 0.3 1.5 0.2 1.7 0.2 A B 1.9 0.2 1.8 0.2 2.0 0.2 B
D2 1.4 1.4 1.4 1.2 0.5 0.9 C C 1.4 1.5 1.7 1.4 0.1 0.2 C C
DFA1 1.4 0.2 1.4 0.2 1.3 0.3 C 0.8 0.2 0.8 0.2 0.8 0.2
DFA2 0.5 0.1 0.4 0.1 0.5 0.1 B 0.3 0.1 0.3 0.1 0.3 0.1
RP_Lmean beats 10.5 3.0 10.5 2.2 9.4 2.6 8.4 2.0 9.0 2.3 7.5 2.0 C
RP_Lmax beats 229.8 114.7 209.1 107.5 155.3 88.0 C 64.0 29.4 67.6 34.4 55.1 26.9
RP_REC 31.3 7.5 31.4 6.0 27.9 7.2 18.8 3.9 19.8 5.8 17.3 5.0
RP_DET 98.2 1.1 98.2 1.2 97.2 1.7 C C 95.7 1.5 96.0 1.8 94.5 2.1 C C
RP_ShanEn 3.1 0.3 3.1 0.2 3.0 0.3 2.8 0.3 2.9 0.3 2.7 0.3 C
RESP Hz 0.2 0.1 0.3 0.1 0.3 0.1 A 0.3 0.0 0.3 0.1 0.3 0.0
Note: Statistically significant differences among groups are indicated by A, B, and C in the P<0.05 columns.
Abbreviations: TD: Time domain; FD: Frequency domain; NL: Non-linear; RR: The interval between 2 subsequent R peaks; SDNN: Standard deviation
Normal to Normal; RMSSD: Root Mean Square of Successive Differences; HR: heart rate; HF: High Frequency; LF: Low Frequency; TOT: total;
pwr: Powe; SD1 and SD2: Poincare Plot parameters; DFA1 and DFA2: Detrended Fluctuation Analysis alfa parameters; ApEn: Approximated Entropy;
SamEn: Sample entropy; RP: Recurrence Plot parameters.
data analyzed from 5-min intervals) and those of both lower RMSSD (23.5 ms in Age1, 22.6 in Age2, and 17.4
Age1 and Age2 groups (A and B in Table 4). in Age3), HFpower (281.6 msec in Age1, 196.7 msec in
2
2
2
During daily activity, sympathetic modulation was Age2, and 89.6 msec in Age3), and SD1 (16.7 ms in Age1,
indicated by higher LFpower (919.5 msec in Age1, 1017.3 16.0 in Age2, and 12.3 in Age3).
2
msec in Age2, and 393.0 msec in Age3) and LF/HF ratio In addition, the VLFpower values were higher during
2
2
(4.5 in Age1, 5.7 in Age2, and 4.9 in Age3), along with activity (101.3 msec in Age1, 107.9 msec in Age2, and
2
2
Volume 2 Issue 4 (2024) 7 doi: 10.36922/bh.3503