
Page 79 - BH-2-4
P. 79
Brain & Heart Automatic cardiac autonomic modulation assessment
80.2 msec in Age3) compared to NREM sleep (42.8 msec those of Age1 and Age2 during both daily activity and
2
2
in Age2, 60.1 msec in Age2, and 22.1 msec in Age3), with NREM sleep (Table 6).
2
2
a statistically significant difference noted only between
Age2 and Age3 during NREM (Table 4). 3.3.2. Kubios indexes during physical training
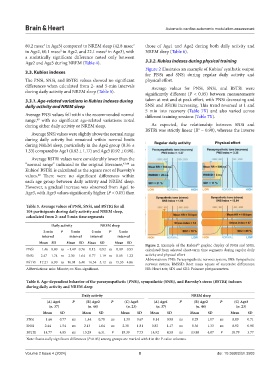
Figure 2 illustrates an example of Kubios’ synthetic output
3.3. Kubios indexes for PNSi and SNSi during regular daily activity and
The PNSi, SNSi, and BSTRi values showed no significant physical effort.
differences when calculated from 2- and 5-min intervals Average values for PNSi, SNSi, and BSTRi were
during daily activity and NREM sleep (Table 5). significantly different (P < 0.05) between measurements
3.3.1. Age-related variations in Kubios indexes during taken at rest and at peak effort, with PNSi decreasing and
daily activity and NREM sleep SNSi and BSTRi increasing. This trend reversed at 1 and
5 min into recovery (Table 7X) and also varied across
Average PNSi values fell within the recommended normal different training sessions (Table 7Y).
range, with no significant age-related variations noted
40
during either daily activity or NREM sleep. As expected, the relationship between SNSi and
BSTRi was strictly linear (R = 0.98), whereas the inverse
2
Average SNSi values were slightly above the normal range
during daily activity but remained within normal limits
during NREM sleep, particularly in the Age2 group (0.36 ±
1.33) compared to Age1 (0.82 ± 1.17) and Age3 (0.92 ± 0.98).
Average BSTRi values were considerably lower than the
“normal range” indicated in the original literature, 43,44 as
Kubios’ BSTRi is calculated as the square root of Baevsky’s
values. There were no significant differences within
40
each age group between daily activity and NREM sleep.
However, a gradual increase was observed from Age1 to
Age3, with Age3 values significantly higher (P < 0.05) than
Table 5. Average values of PNSi, SNSi, and BSTRi for all
104 participants during daily activity and NREM sleep,
calculated from 2‑ and 5‑min time segments
Daily activity NREM sleep
2‑min P 5‑min 2‑min P 5‑min
interval interval interval interval
Mean SD Mean SD Mean SD Mean SD
Figure 2. Example of the Kubios graphic display of PNSi and SNSi,
40
PNSi –1.46 0.80 ns −1.49 0.76 0.12 0.92 ns 0.09 0.95 calculated from selected short-term time segments during regular daily
SNSi 2.47 1.74 ns 2.30 1.64 0.77 1.19 ns 0.65 1.22 activity and physical effort
Abbreviations: PNS: Parasympathetic nervous system; SNS: Sympathetic
BSTRi 17.21 6.90 ns 16.01 6.40 16.34 5.12 ns 15.33 4.86 nervous system; RMSSD: Root mean square of successive differences;
Abbreviations: min: Minute; ns: Non-significant. HR: Heart rate; SD1 and SD2: Poincare plot parameters.
Table 6. Age‑dependent behavior of the parasympathetic (PNSi), sympathetic (SNSi), and Baevsky’s stress (BSTRi) indexes
during daily activity and NREM sleep
Daily activity NREM sleep
(A) Age1 P (B) Age2 P (C) Age3 (A) Age1 P (B) Age2 P (C) Age3
(n. 37) (n. 44) (n. 23) (n. 37) (n. 44) (n. 23)
Mean SD Mean SD Mean SD Mean SD Mean SD Mean SD
PNSi −1.66 0.77 ns −1.44 0.78 ns −1.30 0.67 −0.14 0.90 ns 0.29 1.07 ns 0.09 0.71
SNSi 2.44 1.54 ns 2.13 1.64 ns 2.38 1.81 0.82 1.17 ns 0.36 1.33 ns 0.92 0.98
BSTRi 14.77 4.85 ns 15.29 6.31 # 19.39 7.73 14.92 4.50 ns 13.88 4.87 # 18.79 3.77
Note: Statistically significant differences (P<0.05) among groups are marked with # in the P-value columns.
Volume 2 Issue 4 (2024) 8 doi: 10.36922/bh.3503