
Page 80 - BH-2-4
P. 80
Brain & Heart Automatic cardiac autonomic modulation assessment
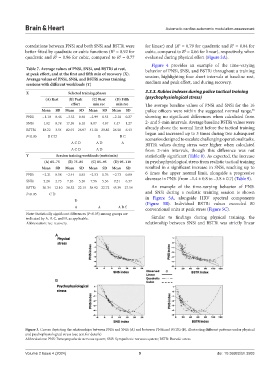
correlations between PNSi and both SNSi and BSTRi were for linear) and (R = 0.79 for quadratic and R = 0.84 for
2
2
better fitted by quadratic or cubic functions (R = 0.92 for cubic, compared to R = 0.66 for linear), respectively, when
2
2
quadratic and R = 0.96 for cubic, compared to R = 0.77 evaluated during physical effort (Figure 3A).
2
2
Figure 4 provides an example of the time-varying
Table 7. Average values of PNSi, SNSi, and BSTRi at rest, behavior of PNSi, SNSi, and BSTRi throughout a training
at peak effort, and at the first and fifth min of recovery (X).
Average values of PNSi, SNSi, and BSTRi across training session, highlighting four short intervals at baseline rest,
sessions with different workloads (Y) medium and peak effort, and during recovery.
X Selected training phases 3.3.3. Kubios indexes during police tactical training
(A) Rest (B) Peak (C) First (D) Fifth (psychophysiological stress)
effort min rec min rec The average baseline values of PNSi and SNSi for the 16
Mean SD Mean SD Mean SD Mean SD police officers were within the suggested normal range,
40
PNSi −1.10 0.46 −3.53 0.40 −2.99 0.55 −2.10 0.27 showing no significant differences when calculated from
SNSi 1.92 0.78 17.59 6.10 8.97 4.67 4.47 1.27 2- and 5-min intervals. Average baseline BSTRi values were
BSTRi 18.22 3.54 82.91 26.97 41.30 20.82 26.58 6.43 already above the normal limit before the tactical training
P<0.05 B C D B B C began and increased up to 3 times during two subsequent
scenarios designed to escalate challenging operational tasks.
A C D A D A BSTRi values during stress were higher when calculated
A C D A D from 2-min intervals, though this difference was not
Y Session training workloads (watts/min) statistically significant (Table 8). As expected, the increase
(A) 65–75 (B) 75–85 (C) 85–95 (D) 95–110 in psychophysiological stress from realistic tactical training
Mean SD Mean SD Mean SD Mean SD resulted in a significant increase in SNSi, reaching up to
PNSi −2.21 0.58 –2.44 0.85 −2.53 0.76 −2.73 0.80 6 times the upper normal limit, alongside a progressive
SNSi 5.28 2.73 7.26 5.20 7.56 5.36 9.21 6.37 decrease in PNSi (from –1.4 ± 0.8 to –3.8 ± 0.7) (Table 9).
BSTRi 30.34 12.10 38.32 22.15 38.92 22.72 45.39 27.59 An example of the time-varying behavior of PNSi
P<0.05 C D and SNSi during a realistic training session is shown
D in Figure 5A, alongside HRV spectral components
(Figure 5B). Individual BSTRi values exceeded 80
A A A B C conventional units at peak stress (Figure 5C).
Note: Statistically significant differences (P<0.05) among groups are
indicated by A, B, C, and D, as applicable. Similar to findings during physical training, the
Abbreviation: rec: recovery. relationship between SNSi and BSTRi was strictly linear
A
B
Figure 3. Curves depicting the relationships between PNSi and SNSi (A) and between PNSi and BSTRi (B), illustrating different patterns under physical
and psychophysiological stress (see text for details)
Abbreviations: PNS: Parasympathetic nervous system; SNS: Sympathetic nervous system; BSTR: Baevski stress.
Volume 2 Issue 4 (2024) 9 doi: 10.36922/bh.3503