
Page 81 - BH-2-4
P. 81
Brain & Heart Automatic cardiac autonomic modulation assessment
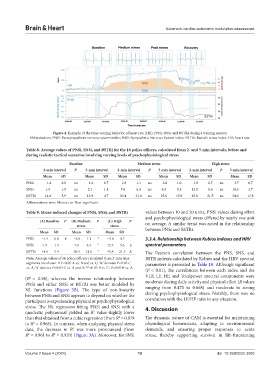
Figure 4. Example of the time-varying behavior of heart rate (HR), PNSi, SNSi, and BSTRi during a training session
Abbreviations: PNSi: Parasympathetic nervous system index; SNSi: Sympathetic Nervous System index; BSTRi: Baevski stress index; HR: heart rate.
Table 8. Average values of PNSi, SNSi, and BSTRi for the 16 police officers, calculated from 2‑ and 5‑min intervals, before and
during realistic tactical scenarios involving varying levels of psychophysiological stress
Baseline Medium stress High stress
2‑min interval P 5‑min interval 2‑min interval P 5‑min interval 2‑min interval P 5‑min interval
Mean SD Mean SD Mean SD Mean SD Mean SD Mean SD
PNSi −1.4 0.8 ns −1.6 0.7 −2.8 1.1 ns −2.8 1.0 −3.8 0.7 ns −3.7 0.7
SNSi 1.9 1.5 ns 2.1 1.4 7.6 6.4 ns 6.5 5.3 12.5 5.6 ns 10.0 3.7
BSTRi 14.0 5.9 ns 13.9 4.7 30.4 21.6 ns 25.0 15.9 45.8 21.5 ns 34.0 13.8
Abbreviations: min: Minute; ns: Non-significant.
Table 9. Stress‑induced changes of PNSi, SNSi, and BSTRi values between 10 and 20 units, PNSi values during effort
and psychophysiological stress differed by nearly one unit
(A) Baseline P (B) Medium P (C) High P
stress stress on average. A similar trend was noted in the relationship
Mean SD Mean SD Mean SD between PNSi and BSTRi.
PNSi −1.4 0.8 # −2.8 1.1 * −3.8 0.7 3.3.4. Relationship between Kubios indexes and HRV
SNSi 1.9 1.5 7.6 6.4 ° 12.5 5.6 § spectral parameters
BSTRi 14.0 5.9 30.4 21.6 ° 45.8 21.5 & The Pearson correlation between the PNS, SNS, and
Note: Average values of 16 police officers calculated from 2-min time BSTR indexes calculated by Kubios and the HRV spectral
segments are shown. # P<0.05 A vs. B and vs. C; ‘&’ denotes P<0.05 C parameters is presented in Table 10. Although significant
vs. A; ‘§’ denotes P<0.05 C vs. A and B; *P<0.05 B vs. C; P<0.05 B vs. A.
(P < 0.01), the correlations between each index and the
(R = 0.98), whereas the inverse relationship between VLF, LF, HF, and Totalpower spectral components were
2
PNSi and either SNSi or BSTRi was better modeled by moderate during daily activity and physical effort (R values
NL functions (Figure 3B). The type of non-linearity ranging from 0.470 to 0.668) and moderate to strong
between PNSi and SNSi appears to depend on whether the during psychophysiological stress. Notably, there was no
participant is experiencing physical or psychophysiological correlation with the LF/HF ratio in any situation.
stress. The NL regression fitting PNSi and SNSi with a 4. Discussion
quadratic polynomial yielded an R value slightly lower
2
than that obtained from a cubic regression (from R = 0.978 The dynamic nature of CAM is essential for maintaining
2
to R = 0.965). In contrast, when analyzing physical stress physiological homeostasis, adapting to environmental
2
data, the decrease in R was more pronounced (from demands, and ensuring proper responses to acute
2
R = 0.961 to R = 0.920) (Figure 3A). Moreover, for SNSi stress, thereby supporting survival in life-threatening
2
2
Volume 2 Issue 4 (2024) 10 doi: 10.36922/bh.3503