
Page 86 - DP-2-3
P. 86
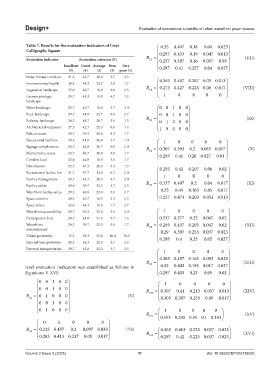
Design+ Evaluation of recreational suitability of urban waterfront green spaces
Table 7. Results for the evaluation indicators of Linyi 0.407 0.18 0.04 0.023 0.35
Calligraphy Square 0.297 0.453 0.19 0.047 0.013
Evaluation indicator Evaluation criterion (%) R C 3 = 0.16 0.057 0.03 0.257 0.497 (VII)
Excellent Good Average Poor Very 0.297 0.41 0.227 0.04 0.027
(5) (4) (3) (2) poor (1)
Noise-limited condition 21.3 45.7 20.0 9.7 3.3
0 263 0 487 0 207 0030 013
. . . . .
Environmental health 28.3 41.3 23.7 5.0 1.7
.
.
.
.
.
Vegetation landscape 35.0 40.7 18.0 4.0 2.3 R C4 = 0 273 0 427 0 223 0060 017 (VIII)
Geomorphologic 29.7 45.3 19.0 4.7 1.3 1 0 0 0 0
landscape
Water landscape 25.7 49.7 16.0 5.7 3.0 00100
Rock landscape 29.7 41.0 22.7 4.0 2.7 00100
Pathway landscape 26.3 48.7 20.7 3.0 1.3 R = 01000 (IX)
C5
Architectural sculptures 27.3 42.7 22.3 6.0 1.7 10000
Folk customs 30.7 39.3 20.0 8.3 1.7
Educational facilities 29.3 41.0 26.0 2.7 1.0 1 0 0 0 0
Signage completeness 29.3 42.0 20.7 6.0 2.0 R = 0 307 0 393. . 02. 0 083 0 017. . (X)
Maintenance status 33.7 40.7 20.0 4.0 1.7 C6 0 293. 041. 0 26 0 027. . 001.
Comfort level 33.0 44.0 16.3 5.0 1.7
Distribution 25.7 47.3 20.3 5.3 1.3 0 293. 042. 0 207. 006. 0 02.
Recreational facility fun 31.7 37.7 22.0 6.7 2.0 1 0 0 0 0
Facility management 29.3 43.7 20.3 4.7 2.0
Facility safety 29.0 39.7 25.3 3.7 2.3 R C7 = 0 337 0 407. . 02. 004. 0 017. (XI)
Waterfront facility safety 29.3 40.0 23.0 5.0 2.7 033. 0..44 . 0 163 . 005 . 0 017
Space comfort 30.3 45.7 16.3 5.3 2.3 . 0 257 0 .473 0 .203 0 .053 0 .013
Space safety 32.0 44.3 19.3 1.7 2.7
Waterfront accessibility 29.7 40.3 23.0 5.0 2.0 1 0 0 0 0
Participation level 30.7 41.0 21.3 5.7 1.3 0 317 0 377. . 022. 0 067. 002.
Waterfront 30.3 39.7 23.3 5.0 1.7 R C8 = 0 293 0 437 0 203 0 047. . . . 002. (XII)
entertainment 0.229 0 397 0 253 0 037 0 023. . . .
Visitor proximity 15.3 29.3 35.0 10.0 10.3 0 293. 04. 023. 0 05. 0 027.
Internal transportation 26.3 46.3 22.3 2.7 2.3
External transportation 29.7 42.0 22.3 3.7 2.3
1 0 0 0 0
0 303 0 457 0 163 0 053 0 023. . . . .
R C9 = (XIII)
level evaluation indicators was established as follows in 032. 0 443 0 193 0 017 0 027. . . .
Equations V-XVI: 0 0 297 0 403. . 023. 0 05. 002.
00100
1 0 0 0 0
00100 R = 0 307. 041. 0 213 0 057 0 013. . . (XIV)
R = 01000 (V) C10 0 303 0 397 0 233. . . 005. 0 017.
C1
00100
01000 1 0 0 0 0
R C11 = 0 153 0 293 0350 10 103. . . . . (XV)
0 1 0 0 0
R C2 = 0 213 0 457. . 02. 0 097 0 033. . (VI) 0 263 0 463 0 223 0 027 0 023. . . . .
0 283 0 413 0 237. . . 005. 0 017. R C12 = 0 297. 042. 0 223 0 037 0 023. . . (XVI)
Volume 2 Issue 3 (2025) 11 doi: 10.36922/DP025110020