
Page 85 - DP-2-3
P. 85
Design+ Evaluation of recreational suitability of urban waterfront green spaces
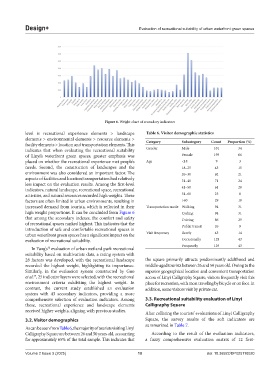
Figure 6. Weight chart of secondary indicators
level is recreational experience elements > landscape Table 6. Visitor demographic statistics
elements > environmental elements > resource elements > Category Subcategory Count Proportion (%)
facility elements > location and transportation elements. This
indicates that when evaluating the recreational suitability Gender Male 101 34
of Linyi’s waterfront green spaces, greater emphasis was Female 199 66
placed on whether the recreational experience met people’s Age <18 9 3
needs. Second, the construction of landscapes and the 18–25 45 15
environment was also considered an important factor. The 26–30 62 21
aspects of facilities and location/transportation had relatively 31–40 71 24
less impact on the evaluation results. Among the first-level
indicators, natural landscape, recreational space, recreational 41–50 61 20
activities, and natural resources recorded high weights. These 51–60 23 8
factors are often limited in urban environments, resulting in >60 29 10
increased demand from tourists, which is reflected in their Transportation mode Walking 94 31
high weight proportions. It can be concluded from Figure 6 Cycling 94 31
that among the secondary indexes, the comfort and safety Driving 86 29
of recreational spaces ranked highest. This indicates that the Public transit 26 9
introduction of safe and comfortable recreational spaces in
urban waterfront green spaces has a significant impact on the Visit frequency Rarely 43 14
evaluation of recreational suitability. Occasionally 128 43
Frequently 129 43
In Yang’s evaluation of urban wetland park recreational
32
suitability based on multivariate data, a rating system with
28 factors was developed, with the recreational landscape the square primarily attracts predominantly adulthood and
recorded the highest weight, highlighting its importance. middle-aged tourists between 26 and 50 years old. Owing to the
Similarly, in the evaluation system constructed by Guo superior geographical location and convenient transportation
et al. , 25 indicator layers were selected, with the recreational access of Linyi Calligraphy Square, visitors frequently visit this
49
environment criteria exhibiting the highest weight. In place for recreation, with most traveling by bicycle or on foot. In
contrast, the current study established an evaluation addition, some visitors visit by private car.
system with 43 secondary indicators, providing a more
comprehensive selection of evaluation indicators. Among 3.3. Recreational suitability evaluation of Linyi
these, recreational experience and landscape elements Calligraphy Square
received higher weights, aligning with previous studies. After collating the tourists’ evaluations of Linyi Calligraphy
3.2. Visitor demographics Square, the survey results of the soft indicators are
summarized in Table 7.
As can be seen from Table 6, the majority of tourists visiting Linyi
Calligraphy Square are between 26 and 50 years old, accounting According to the result of the evaluation indicators,
for approximately 65% of the total sample. This indicates that a fuzzy comprehensive evaluation matrix of 12 first-
Volume 2 Issue 3 (2025) 10 doi: 10.36922/DP025110020