
Page 83 - DP-2-3
P. 83
Design+ Evaluation of recreational suitability of urban waterfront green spaces
frequency, and a recreational suitability evaluation form 3. Results and discussion
(Appendix 2). Through on-site distribution and online
questionnaire survey, 320 questionnaires were distributed, 3.1. Index weight results
and a total of 300 valid questionnaires were recovered, an Scoring data from 30 experts and related practitioners
effective rate of 93.75%. These data were imported into were collected through the Wen Juan Xing application and
Microsoft Excel (version 2003), and the comprehensive questionnaires to calculate the weight and consistency test of
score of recreational suitability was calculated using the indicators at each level. All matrices in this study passed the
fuzzy comprehensive evaluation method. consistency tests (consistency ratio <0.1), and the recreational
suitability evaluation system of Linyi’s waterfront green spaces
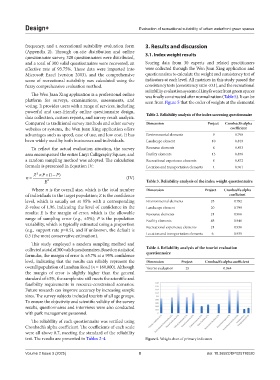
The Wen Juan Xing application is a professional online was finally constructed after normalization (Table 5). It can be
platform for surveys, examinations, assessments, and seen from Figure 5 that the order of weights at the elemental
voting. It provides users with a range of services, including
powerful and user-friendly online questionnaire design, Table 2. Reliability analysis of the index screening questionnaire
data collection, custom reports, and survey result analysis.
Compared to traditional survey methods and other survey Dimension Project Cronbach’s alpha
websites or systems, the Wen Juan Xing application offers coefficient
advantages such as speed, ease of use, and low cost. It has Environmental elements 9 0.790
been widely used by both businesses and individuals. Landscape element 10 0.819
To reflect the actual evaluation situation, the survey Resource elements 8 0.853
area encompassed the entire Linyi Calligraphy Square, and Facility elements 13 0.876
a random sampling method was adopted. The calculation Recreational experience elements 8 0.872
formula is presented in Equation IV: Location and transportation elements 4 0.761
P (
1
2
Z ×× − P)
n = (IV)
E 2 Table 3. Reliability analysis of the index weight questionnaire
Where n is the overall size, which is the total number Dimension Project Cronbach’s alpha
of individuals in the target population; Z is the confidence coefficient
level, which is usually set at 95% with a corresponding Environmental elements 28 0.782
Z-value of 1.96, indicating the level of confidence in the Landscape element 20 0.799
results; E is the margin of error, which is the allowable Resource elements 21 0.966
range of sampling error (e.g., ±5%); P is the population Facility elements 45 0.946
variability, which is typically estimated using a proportion Recreational experience elements 21 0.936
(e.g., support rate p=0.5), and if unknown, the default is
0.5 (the most conservative estimation). Location and transportation elements 6 0.935
This study employed a random sampling method and
collected a total of 300 valid questionnaires. Based on statistical Table 4. Reliability analysis of the tourist evaluation
questionnaire
formulas, the margin of error is ±5.7% at a 95% confidence
level, indicating that the results can reliably represent the Dimension Project Cronbach’s alpha coefficient
overall population of Lanshan Road (n = 160,000). Although Tourist evaluation 25 0.964
the margin of error is slightly higher than the general
standard of ±5%, the sample size still meets the scientific and
feasibility requirements in resource-constrained scenarios.
Future research can improve accuracy by increasing sample
sizes. The survey subjects included tourists of all age groups.
To ensure the objectivity and scientific validity of the survey
results, questionnaires and interviews were also conducted
with park management personnel.
The reliability of each questionnaire was verified using
Cronbach’s alpha coefficient. The coefficients of each scale
were all above 0.7, meeting the standard of the reliability
test. The results are presented in Tables 2-4. Figure 5. Weight chart of primary indicators
Volume 2 Issue 3 (2025) 8 doi: 10.36922/DP025110020