
Page 96 - EER-2-1
P. 96
Explora: Environment
and Resource Artificial neural networks
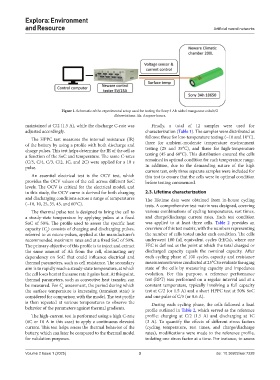
Figure 1. Schematic of the experimental setup used for testing the Sony 3 Ah nickel manganese cobalt/G
Abbreviations: Ah: Ampere-hours.
maintained at C/2 (1.5 A), while the discharge C-rate was Finally, a total of 12 samples were used for
adjusted accordingly. characterization (Table 1). The samples were distributed as
The HPPC test measures the internal resistance (IR) follows: three for low-temperature testing (−10 and 10°C),
of the battery by using a profile with both discharge and three for ambient-moderate temperature environment
charge pulses. This test helps determine the IR of the cell as testing (25 and 35°C), and three for high-temperature
a function of the SoC and temperature. The same C-rates testing (45 and 60°C). This distribution ensured the cells
(C/5, C/4, C/3, C/2, 1C, and 2C) were applied for a 10 s remained in optimal condition for each temperature range.
pulse. In addition, due to the demanding nature of the high
current test, only three separate samples were included for
An essential electrical test is the OCV test, which this test to ensure that the cells were in optimal condition
provides the OCV values of the cell across different SoC before testing commenced.
levels. The OCV is critical for the electrical model, and
in this study, the OCV curve is derived for both charging 2.3. Lifetime characterization
and discharging conditions across a range of temperatures The lifetime data were obtained from in-house cycling
(−10, 10, 25, 35, 45, and 60°C). tests. A comprehensive test matrix was designed, covering
The thermal pulse test is designed to bring the cell to various combinations of cycling temperatures, rest times,
a steady-state temperature by applying pulses at a fixed and charge/discharge current rates. Each test condition
SoC of 50%. The profile used to assess the specific heat was applied to at least three cells. Table 2 provides an
capacity (C ) consists of charging and discharging pulses, overview of this test matrix, with the numbers representing
p
referred to as micro-pulses, applied at the manufacturer’s the number of cells tested under each condition. The cells
recommended maximum rates and at a fixed SoC of 50%. underwent 100 full equivalent cycles (FECs), where one
The primary objective of this profile is to inject and extract FEC is defined as the point at which the total charged or
the same amount of Ah from the cell, eliminating any discharged capacity equals the nominal capacity. After
dependency on SoC that could influence electrical and each cycling phase of 100 cycles, capacity and resistance
thermal parameters, such as cell resistance. The secondary measurements were conducted at 25°C to evaluate the aging
aim is to rapidly reach a steady-state temperature, at which state of the cells by measuring capacity and impedance
the cell loses heat at the same rate it gains heat. At this point, evolution. For this purpose, a reference performance
thermal parameters, such as convective heat transfer, can test (RPT) was performed on a regular interval and at a
be measured. For C assessment, the period during which constant temperature, typically involving a full capacity
p
the surface temperature is increasing (transient state) is test at C/2 (or 1.5 A) and a short HPPC test at 50% SoC
considered for comparison with the model. The test profile and one pulse of C/5 (or 0.6 A).
is then repeated at various temperatures to observe the During each cycling phase, the cells followed a load
behavior of the parameters against thermal gradients. profile outlined in Table 2, which served as the reference
The high-current test is performed using a high C-rate profile: charging at C/2 (1.5 A) and discharging at 1C
(6C or 18 A in this case) to apply a continuous elevated (3 A). To quantify the effects of different stress factors
current. This test helps assess the thermal behavior of the (cycling temperature, rest times, and charge/discharge
battery, which can later be compared to the thermal model rates), modifications were made to the reference profile,
for validation purposes. isolating one stress factor at a time. For instance, to assess
Volume 2 Issue 1 (2025) 3 doi: 10.36922/eer.7228