
Page 99 - EER-2-1
P. 99
Explora: Environment
and Resource Artificial neural networks
Table 3. Capacity of Sony 3 Ah at different C‑rates and A
temperatures
C‑rate Capacity at different temperatures (Ah)
−10°C 10°C 25°C 35°C 45°C 60°C
C/5 2.46 2.74 2.96 3.04 3.09 3.11
C/4 2.46 2.73 2.94 3.03 3.08 3.10
C/3 2.43 2.72 2.93 3.02 3.07 3.09
C/2 2.42 2.72 2.90 3.01 3.06 3.08
1C 2.50 2.71 2.88 2.99 3.05 3.07
2C 2.52 2.70 2.86 2.99 3.04 3.06
B
Table 4. Specific heat capacity of Sony 3 Ah at different
temperatures
Temperature (°C) Specific heat capacity (J/kg°C)
−10 1275
10 1258
25 1280
35 1269
45 1274
60 1282
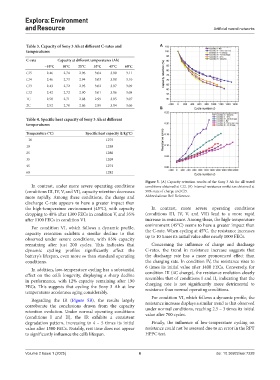
Figure 5. (A) Capacity retention results of the Sony 3 Ah for all tested
In contrast, under more severe operating conditions conditions obtained at C/2. (B) Internal resistance evolution obtained at
(conditions III, IV, V, and VI), capacity retention decreases 50% state of charge and C/5.
more rapidly. Among these conditions, the charge and Abbreviations: Ref: Reference.
discharge C-rate appears to have a greater impact than
the high-temperature environment (45°C), with capacity In contrast, more severe operating conditions
dropping to 40% after 1300 FECs in condition V, and 35% (conditions III, IV, V, and VII) lead to a more rapid
after 1100 FECs in condition VI. increase in resistance. Among these, the high-temperature
For condition VI, which follows a dynamic profile, environment (45°C) seems to have a greater impact than
capacity retention exhibits a similar decline to that the C-rate. When cycling at 45°C, the resistance increases
observed under severe conditions, with 85% capacity up to 10 times its initial value after nearly 1000 FECs.
remaining after just 200 cycles. This indicates that Concerning the influence of charge and discharge
dynamic cycling profiles significantly affect the C-rates, the trend in resistance increase suggests that
battery’s lifespan, even more so than standard operating the discharge rate has a more pronounced effect than
conditions. the charging rate. In condition IV, the resistance rises to
In addition, low-temperature cycling has a substantial 6 times its initial value after 1400 FECs. Conversely, for
effect on the cell’s longevity, displaying a sharp decline condition III (4C charge), the resistance evolution closely
in performance, with 12% capacity remaining after 190 resembles that of conditions I and II, indicating that the
FECs. This suggests that cycling the Sony 3 Ah at low charging rate is not significantly more detrimental to
temperatures accelerates aging considerably. resistance than normal operating conditions.
Regarding the IR (Figure 5B), the results largely For condition VI, which follows a dynamic profile, the
corroborate the conclusions drawn from the capacity resistance increase displays a similar trend to that observed
retention evolution. Under normal operating conditions under normal conditions, reaching 2.5 – 3 times its initial
(conditions I and II), the IR exhibits a consistent value after 700 cycles.
degradation pattern, increasing to 4 – 5 times its initial Finally, the influence of low-temperature cycling on
value after 1500 FECs. Notably, rest time does not appear resistance could not be assessed due to an error in the RPT
to significantly influence the cell’s lifespan. HPPC test.
Volume 2 Issue 1 (2025) 6 doi: 10.36922/eer.7228