
Page 101 - EER-2-1
P. 101
Explora: Environment
and Resource Artificial neural networks
(i) The cell’s surface temperature, T , is assumed to experimental data. The table highlights that the model has
cell
be uniformly distributed across the entire surface, an average error of around 2%, demonstrating the strong
representing the overall temperature of the battery accuracy of the electrical modeling and parameter estimation.
(ii) Joule heating is used for estimating the heat generation For thermal validation, the test involved discharging
(iii) Natural convective heat transfer is considered, with the battery from 100% to 0% SoC at a high current
parameters such as ambient temperature (T , °C), (Section 2.2). Figure 7B compares the simulated delta T
amb
surface area of heat exchange (S , m²), and convective (temperature differences) from the thermal model with the
area
heat transfer coefficient (h conv , W/m².K)
(iv) The specific heat capacity was obtained from the actual measured temperature. The estimated temperature
closely aligns with the measured values, with a deviation
thermal pulse test (Section 2.2) and the surface area of <2°C. Furthermore, the RMSE values for thermal
was calculated directly based on the cell dimensions
(S = 0.004327 m²). In addition, a natural convection validation across all tested temperatures are provided in
area
coefficient of h conv = 15 W/m².K was applied. 54
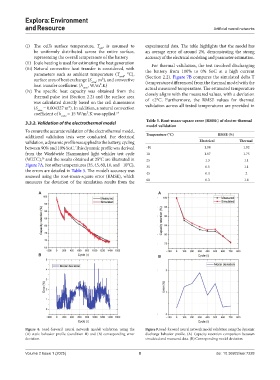
Table 5. Root‑mean‑square error (RMSE) of electro‑thermal
3.3.2. Validation of the electrothermal model
model validation
To ensure the accurate validation of the electrothermal model,
additional validation tests were conducted. For electrical Temperature (°C) RMSE (%)
validation, a dynamic profile was applied to the battery, cycling Electrical Thermal
between 90% and 10% SoC. This dynamic profile was derived -10 1.98 1.92
from the Worldwide Harmonized light vehicles test cycle 10 1.87 1.75
(WLTC), and the results obtained at 25°C are illustrated in 25 1.3 1.1
56
Figure 7A. For other temperatures (35, 45, 60, 10, and −10°C), 35 0.5 1.1
the errors are detailed in Table 5. The model’s accuracy was 45 0.4 2
assessed using the root-mean-square error (RMSE), which
measures the deviation of the simulation results from the 60 0.3 1.6
A A
B B
Figure 8. Feed-forward neural network model validation using the Figure 9. Feed-forward neural network model validation using the dynamic
(A) static behavior profile (condition II) and (B) corresponding error discharge behavior profile. (A) Capacity retention comparison between
deviation. simulated and measured data. (B) Corresponding model deviation.
Volume 2 Issue 1 (2025) 8 doi: 10.36922/eer.7228