
Page 98 - EER-2-1
P. 98
Explora: Environment
and Resource Artificial neural networks
A
B
Figure 2. Schematics of the electrothermal and aging model
Abbreviation: SoC: State of charge.
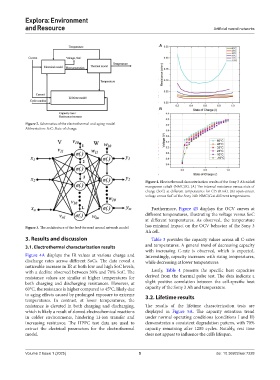
Figure 4. Electrothermal characterization results of the Sony 3 Ah nickel
manganese cobalt (NMC)/G. (A) The internal resistance versus state of
charge (SoC) at different temperatures for C/5 (0.6A). (B) open-circuit
voltage versus SoC of the Sony 3Ah NMC/G at different temperatures.
Furthermore, Figure 4B displays the OCV curves at
different temperatures, illustrating the voltage versus SoC
at different temperatures. As observed, the temperature
Figure 3. The architecture of the feed-forward neural network model has minimal impact on the OCV behavior of the Sony 3
Ah cell.
3. Results and discussion Table 3 provides the capacity values across all C-rates
3.1. Electrothermal characterization results and temperatures. A general trend of decreasing capacity
with increasing C-rate is observed, which is expected.
Figure 4A displays the IR values at various charge and Interestingly, capacity increases with rising temperatures,
discharge rates across different SoCs. The data reveal a while decreasing at lower temperatures.
noticeable increase in IR at both low and high SoC levels,
with a decline observed between 30% and 70% SoC. The Lastly, Table 4 presents the specific heat capacities
resistance values are similar at higher temperatures for derived from the thermal pulse test. The data indicate a
both charging and discharging resistances. However, at slight positive correlation between the cell-specific heat
60°C, the resistance is higher compared to 45°C, likely due capacity of the Sony 3 Ah and temperature.
to aging effects caused by prolonged exposure to extreme 3.2. Lifetime results
temperatures. In contrast, at lower temperatures, the
resistance is elevated in both charging and discharging, The results of the lifetime characterization tests are
which is likely a result of slowed electrochemical reactions displayed in Figure 5A. The capacity retention trend
in colder environments, hindering Li-ion transfer and under normal operating conditions (conditions I and II)
increasing resistance. The HPPC test data are used to demonstrates a consistent degradation pattern, with 70%
extract the electrical parameters for the electrothermal capacity remaining after 1200 cycles. Notably, rest time
model. does not appear to influence the cell’s lifespan.
Volume 2 Issue 1 (2025) 5 doi: 10.36922/eer.7228