
Page 101 - EER-2-3
P. 101
Explora: Environment
and Resource Comparative analysis of THMs and THAAs in water distribution media
0.199 mg/L to negligible levels, indicating an approximate 3.3. Comparison
removal efficiency of 99%. The second filtration setup From a comparative perspective on the formation of DBPs
(GAC media) achieved an estimated 99% removal of both in water samples passed through GI and HDPE pipes, it was
THMs and THAAs, thereby demonstrating its superior observed that in the GI pipe water samples, approximately
performance.
0.212 mg/L of THAAs and 0.199 mg/L of THMs were
In the HDPE pipe, water samples from Zone 3 were detected under a chlorine dosage of 2.4 mg/L, while
analyzed after passing through both the first (sand media) approximately 0.193 mg/L of THMs were detected under
and second (GAC media) filtration setups. Based on a chlorine dosage of 1.8 mg/L in a controlled environment.
the obtained chromatograms, no prominent chlorine
DBPs—or related halogenated compounds—were Similarly, in the HDPE pipe water sample, under a
detected. The absence of THMs and THAAs after filtration chlorine dosage of 2.4 mg/L, approximately 0.2 mg/L of
demonstrates the combined effectiveness of the pipe THAAs and 0.167 mg/L of THMs were detected. These
material and the filtration media in reducing precursors, results indicate that lower chlorine dosages resulted in
including dissolved and suspended organic particles. This lower concentrations of chlorine DBPs. With a 33% increase
highlights adsorption-based filtration as a cost-effective in chlorine dosage, THAAs in the GI pipe water sample
abatement strategy. Both filtration setups successfully increased to 0.212 mg/L, and THMs increased by 3.11%,
reduced the initially identified 0.2 mg/L of THAAs to while a comparable trend was observed in the HDPE pipe
negligible levels, indicating a high removal capacity for water samples. This pattern supports the hypothesis that an
the HDPE pipe system. The reduction in dissolved organic increased chlorine dosage enhances reactions with NOM
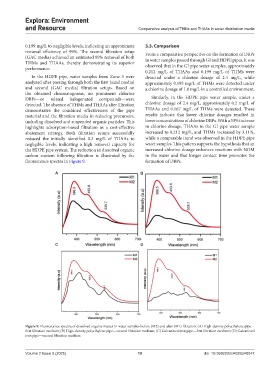
carbon content following filtration is illustrated by the in the water and that longer contact time promotes the
fluorescence spectra in Figure 9. formation of DBPs.
A B
C D
Figure 9. Fluorescence spectra of dissolved organic matter in water samples before (M2) and after (M1) filtration: (A) High-density polyethylene pipe—
first filtration medium; (B) High-density polyethylene pipe—second filtration medium; (C) Galvanized iron pipe—first filtration medium; (D) Galvanized
iron pipe—second filtration medium
Volume 2 Issue 3 (2025) 10 doi: 10.36922/EER025240047