
Page 97 - EER-2-3
P. 97
Explora: Environment
and Resource Comparative analysis of THMs and THAAs in water distribution media
Technologies, United States of America). A fused silica water distribution network model and observed the
capillary DB-1 column (30 m × 0.32 mm inner diameter × corresponding variations in DBP formation at different
0.25 µm film thickness) was used. Helium (99.99% purity) controlled chlorine dosages.
served as the carrier gas, and nitrogen (99.99%) was used In this study, the fractions of DBPs detected in water
as the makeup gas. The analytical operating conditions are samples from Zone 1, Zone 2, and Zone 3 varied. Key
summarized in Table S1. psychochemical characteristics contributing to DBP
Standard internal peak areas were used to prepare the formation were identified for each sample. The analysis was
calibration standards. A linear regression equation was carried out in phases, beginning with a dosage of 0.2 mg/L,
applied to generate the calibration curve and calculate followed by 1.8 mg/L, and finally 2.4 mg/L, applied to both
the concentration in the extract (C extract ), as shown in pipe materials.
Equation II. After obtaining C extract , the concentration in At the initial chlorine dosage of 0.2 mg/L, the results
the water sample (C water ) was determined using Equation (Figure S1) show no detectable levels of THMs and THAAs
III, based on the sample and extract volumes. Finally, both in the chromatograms for both pipe types (Figure S2).
values were inserted into Equation I to calculate the total Other chlorine-related compounds with chromatographic
concentration of chlorine DBPs, with full equation details retention are identified and listed in Table S2. The absence
provided in the Supplementary File. of THMs and THAAs may be attributed to the very low
TTHMs + THAAs = Prominent chlorine DBPs (I) residual chlorine concentration, which is likely insufficient
to initiate significant DBP formation.
Measured peak area
C mb (II) A chlorine dosage of 1.8 mg/L was applied to the Zone 2
extract
Peak area of internal standard
water sample to evaluate the formation of THMs and THAAs
in water samples passed through GI and HDPE pipes. Key
C V
C extract extract (III) water quality parameters—including pH, DO, turbidity,
water
V
water taste, temperature, hardness, and DOM—were measured
before GC-MS (ECD) analysis, as shown in Figure S3.
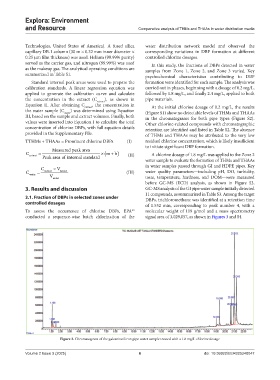
3. Results and discussion GC-MS analysis of the GI pipe water sample initially detected
11 compounds, as summarized in Table S3. Among the target
3.1. Fraction of DBPs in selected zones under DBPs, trichloromethane was identified at a retention time
controlled dosages of 1.532 min, corresponding to peak number 4, with a
To assess the occurrence of chlorine DBPs, EPA molecular weight of 119 g/mol and a mass spectrometry
33
conducted a sequence-wise batch chlorination of the signal area of 3,029,057, as shown in Figures 3 and S4.
Figure 3. Chromatogram of the galvanized iron pipe water sample treated with a 1.8 mg/L chlorine dosage
Volume 2 Issue 3 (2025) 6 doi: 10.36922/EER025240047